| __timestamp | Axon Enterprise, Inc. | Pool Corporation |
|---|---|---|
| Wednesday, January 1, 2014 | 101548000 | 643340000 |
| Thursday, January 1, 2015 | 128647000 | 675644000 |
| Friday, January 1, 2016 | 170536000 | 741087000 |
| Sunday, January 1, 2017 | 207088000 | 805289000 |
| Monday, January 1, 2018 | 258583000 | 870173000 |
| Tuesday, January 1, 2019 | 307286000 | 924925000 |
| Wednesday, January 1, 2020 | 416331000 | 1130902000 |
| Friday, January 1, 2021 | 540910000 | 1617092000 |
| Saturday, January 1, 2022 | 728638000 | 1933412000 |
| Sunday, January 1, 2023 | 955382000 | 1660044000 |
Data in motion
In the dynamic world of business, understanding the financial health of companies is crucial. This analysis delves into the gross profit trends of two industry leaders: Axon Enterprise, Inc. and Pool Corporation, from 2014 to 2023. Over this period, Axon Enterprise, Inc. has shown a remarkable growth trajectory, with its gross profit increasing by over 840%, from approximately $101 million in 2014 to nearly $956 million in 2023. Meanwhile, Pool Corporation, a titan in its own right, saw its gross profit rise by about 158%, peaking at around $1.93 billion in 2022 before a slight dip in 2023. This comparison highlights Axon's aggressive growth strategy, outpacing Pool's more steady expansion. As the market evolves, these trends offer valuable insights into the strategic maneuvers of these companies, providing a window into their future potential.
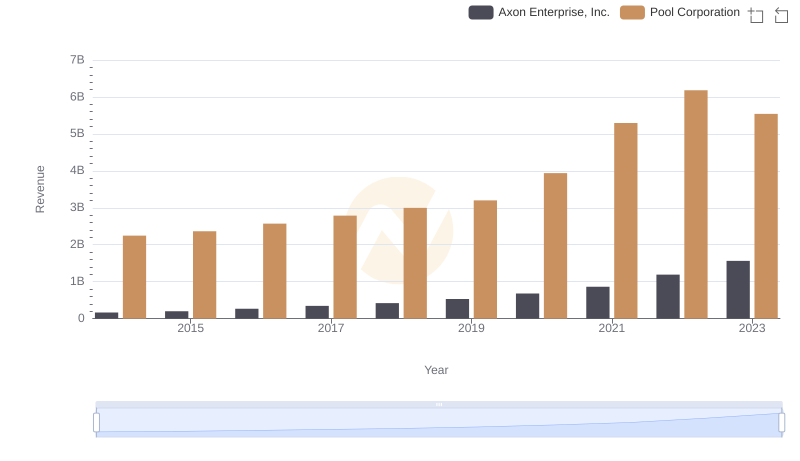
Axon Enterprise, Inc. vs Pool Corporation: Annual Revenue Growth Compared
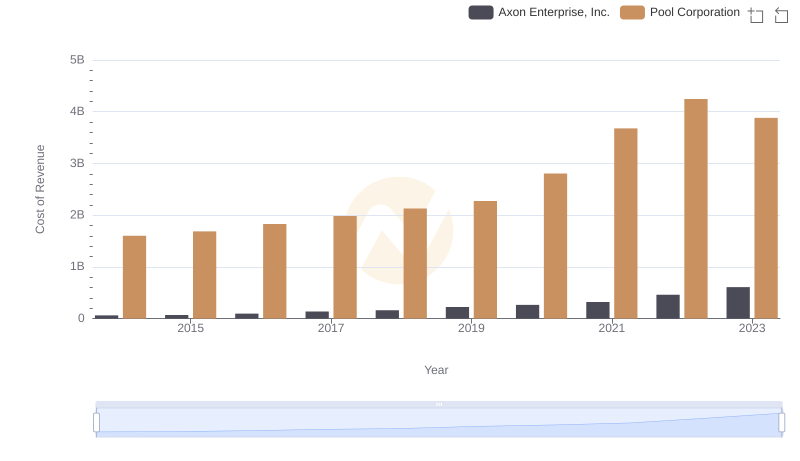
Cost of Revenue Comparison: Axon Enterprise, Inc. vs Pool Corporation
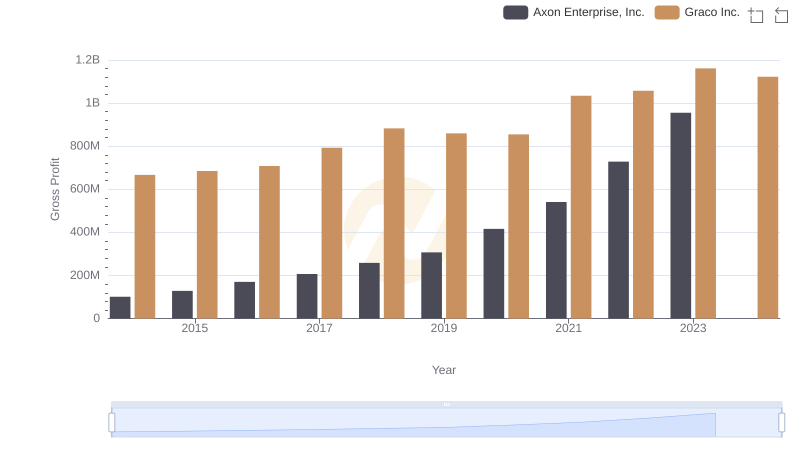
Axon Enterprise, Inc. vs Graco Inc.: A Gross Profit Performance Breakdown
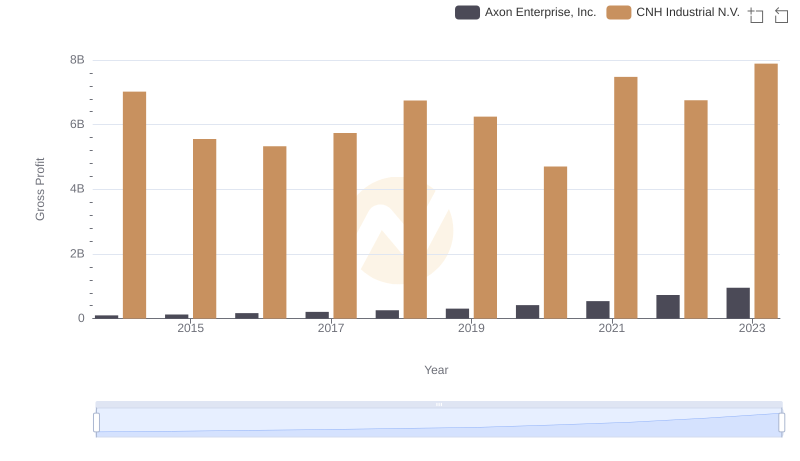
Who Generates Higher Gross Profit? Axon Enterprise, Inc. or CNH Industrial N.V.
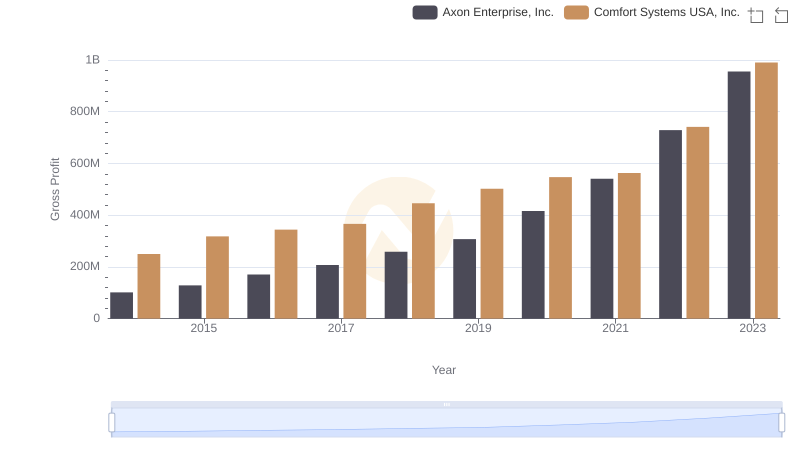
Gross Profit Comparison: Axon Enterprise, Inc. and Comfort Systems USA, Inc. Trends
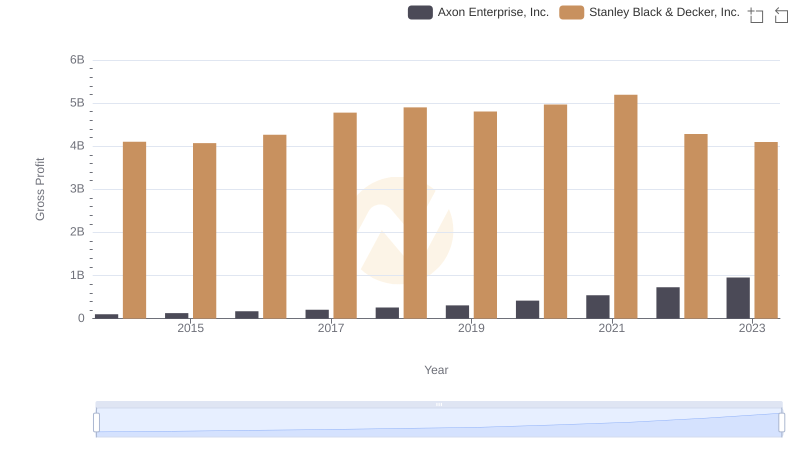
Who Generates Higher Gross Profit? Axon Enterprise, Inc. or Stanley Black & Decker, Inc.
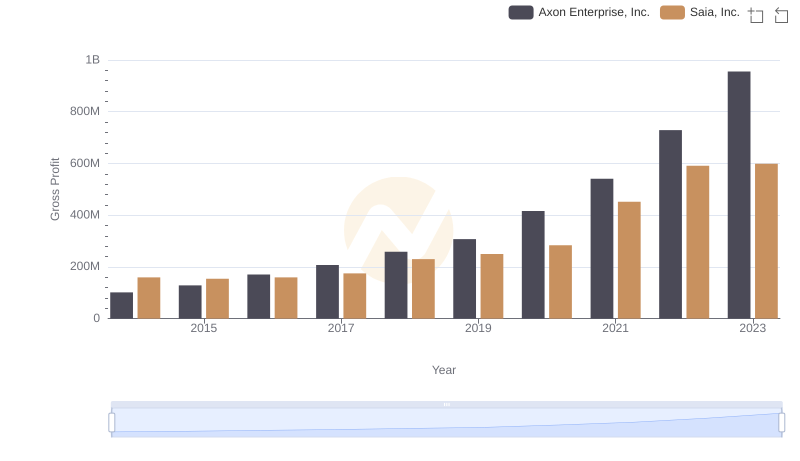
Gross Profit Comparison: Axon Enterprise, Inc. and Saia, Inc. Trends
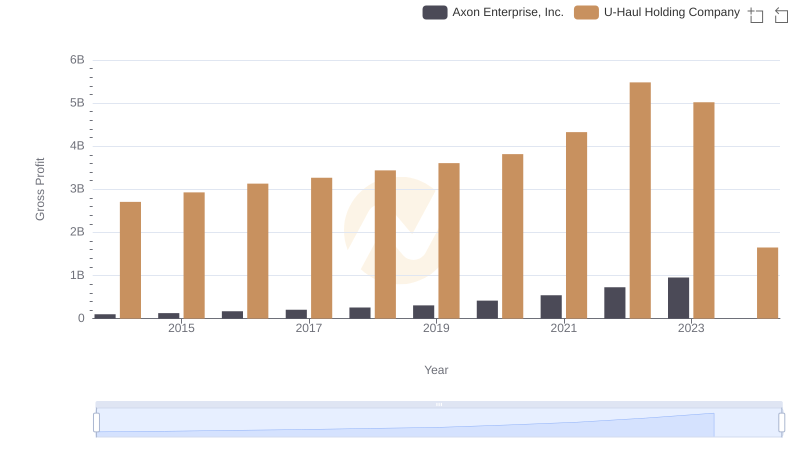
Gross Profit Analysis: Comparing Axon Enterprise, Inc. and U-Haul Holding Company
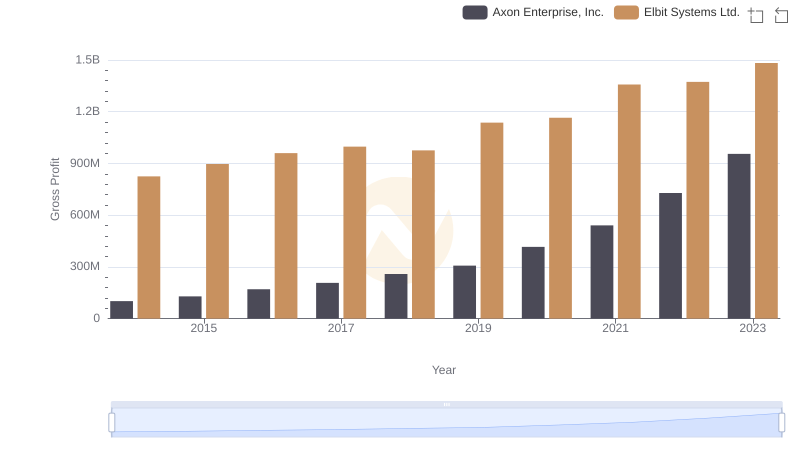
Gross Profit Analysis: Comparing Axon Enterprise, Inc. and Elbit Systems Ltd.
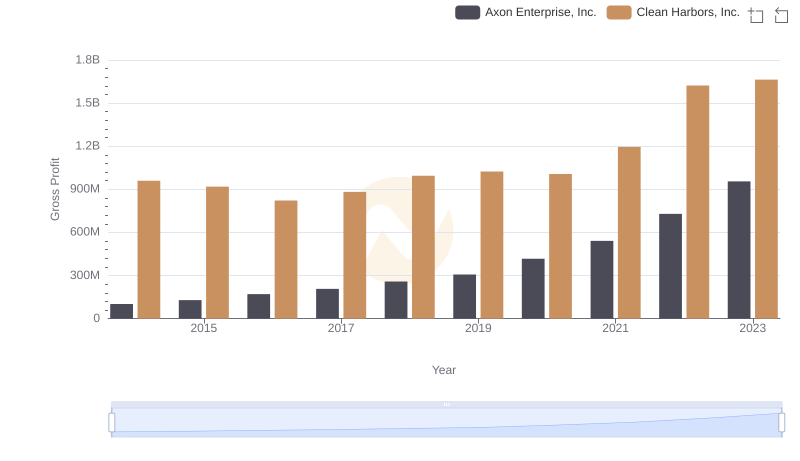
Key Insights on Gross Profit: Axon Enterprise, Inc. vs Clean Harbors, Inc.
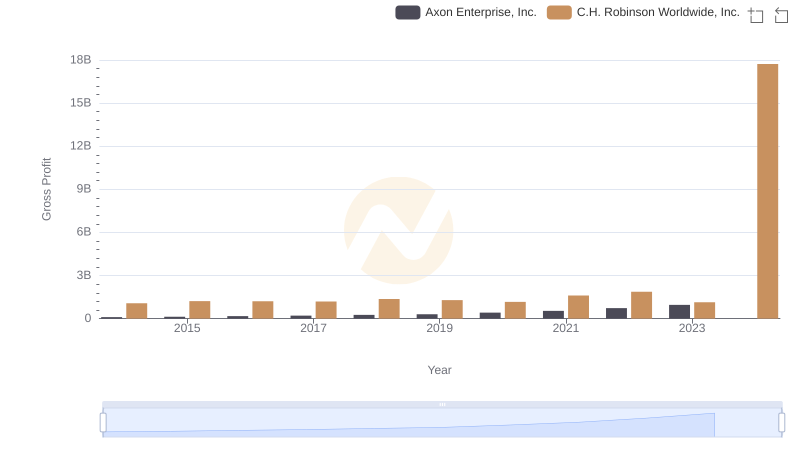
Gross Profit Trends Compared: Axon Enterprise, Inc. vs C.H. Robinson Worldwide, Inc.
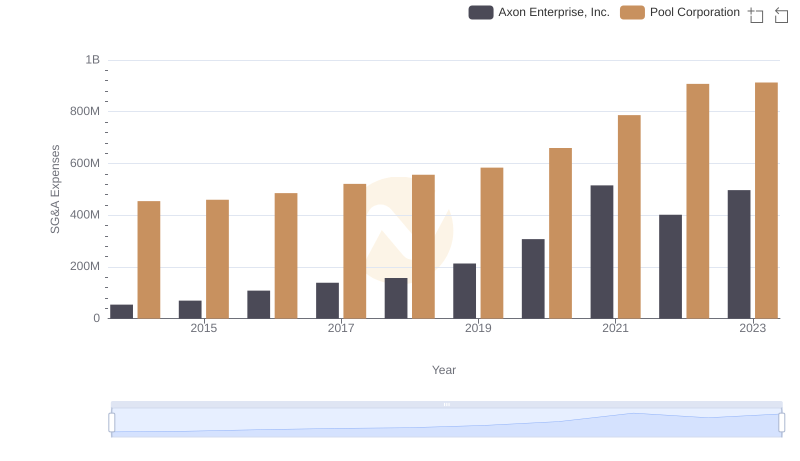
Comparing SG&A Expenses: Axon Enterprise, Inc. vs Pool Corporation Trends and Insights