| __timestamp | Axon Enterprise, Inc. | Pool Corporation |
|---|---|---|
| Wednesday, January 1, 2014 | 164525000 | 2246562000 |
| Thursday, January 1, 2015 | 197892000 | 2363139000 |
| Friday, January 1, 2016 | 268245000 | 2570803000 |
| Sunday, January 1, 2017 | 343798000 | 2788188000 |
| Monday, January 1, 2018 | 420068000 | 2998097000 |
| Tuesday, January 1, 2019 | 530860000 | 3199517000 |
| Wednesday, January 1, 2020 | 681003000 | 3936623000 |
| Friday, January 1, 2021 | 863381000 | 5295584000 |
| Saturday, January 1, 2022 | 1189935000 | 6179727000 |
| Sunday, January 1, 2023 | 1563391000 | 5541595000 |
In pursuit of knowledge
In the ever-evolving landscape of American business, Axon Enterprise, Inc. and Pool Corporation have emerged as significant players in their respective industries. Over the past decade, from 2014 to 2023, these companies have demonstrated remarkable revenue growth, albeit at different scales. Axon Enterprise, known for its innovative public safety technologies, has seen its revenue grow nearly tenfold, from approximately $165 million in 2014 to over $1.5 billion in 2023. This represents an impressive annual growth rate of around 30%.
Meanwhile, Pool Corporation, a leader in the distribution of swimming pool supplies, has maintained a steady growth trajectory, with revenues increasing from $2.2 billion in 2014 to $5.5 billion in 2023. This growth, averaging about 10% annually, underscores the company's robust market position. As these companies continue to expand, their contrasting growth patterns offer valuable insights into strategic business development.
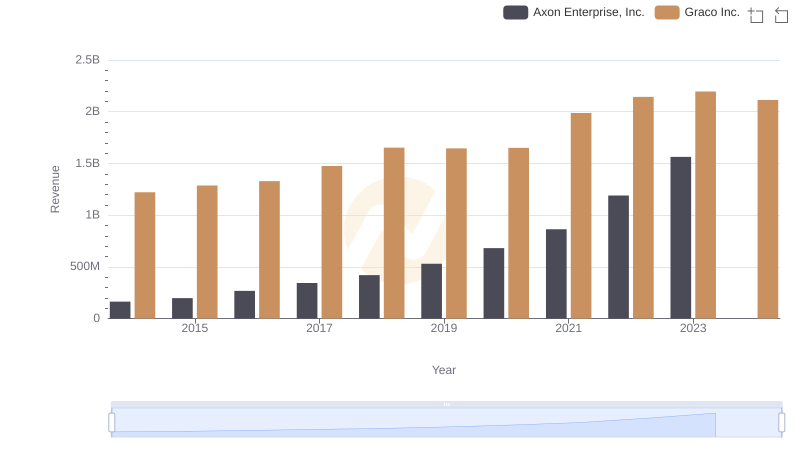
Axon Enterprise, Inc. vs Graco Inc.: Examining Key Revenue Metrics
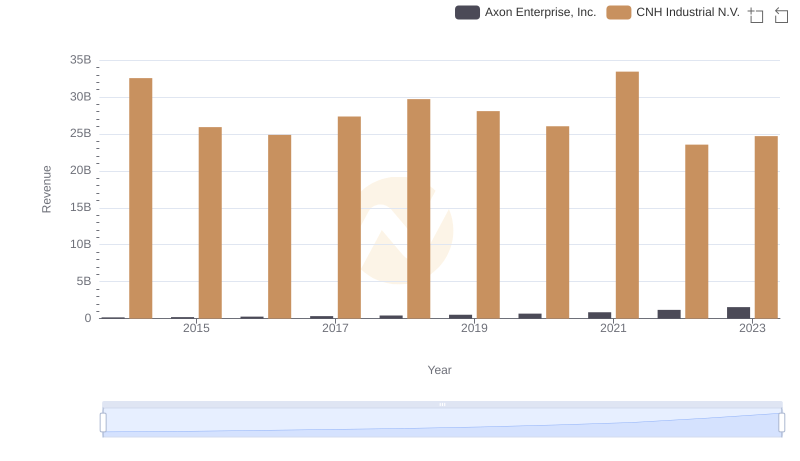
Axon Enterprise, Inc. vs CNH Industrial N.V.: Examining Key Revenue Metrics
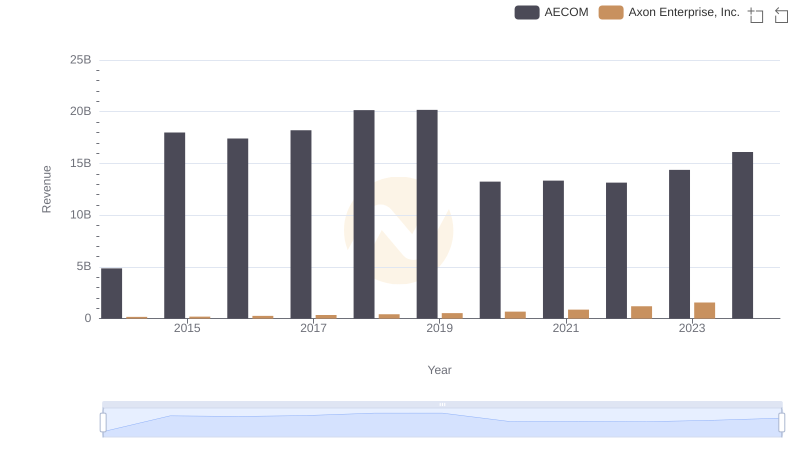
Who Generates More Revenue? Axon Enterprise, Inc. or AECOM
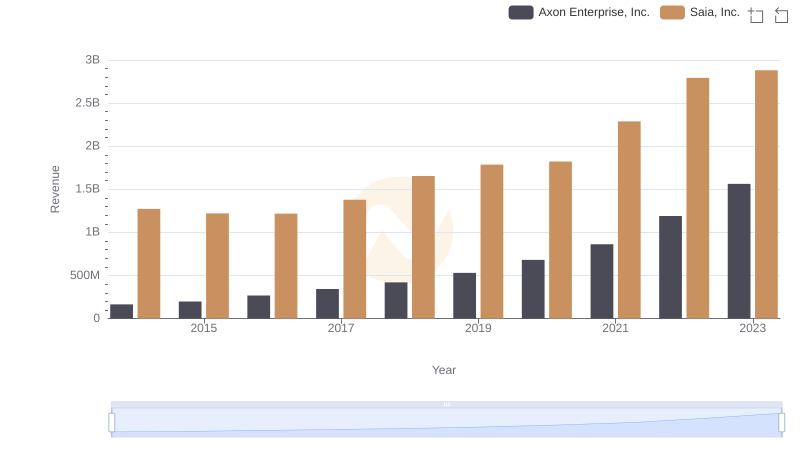
Axon Enterprise, Inc. or Saia, Inc.: Who Leads in Yearly Revenue?
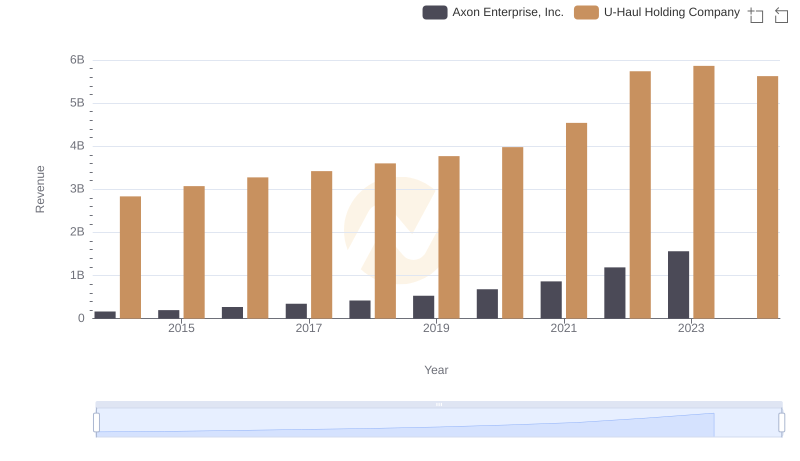
Who Generates More Revenue? Axon Enterprise, Inc. or U-Haul Holding Company
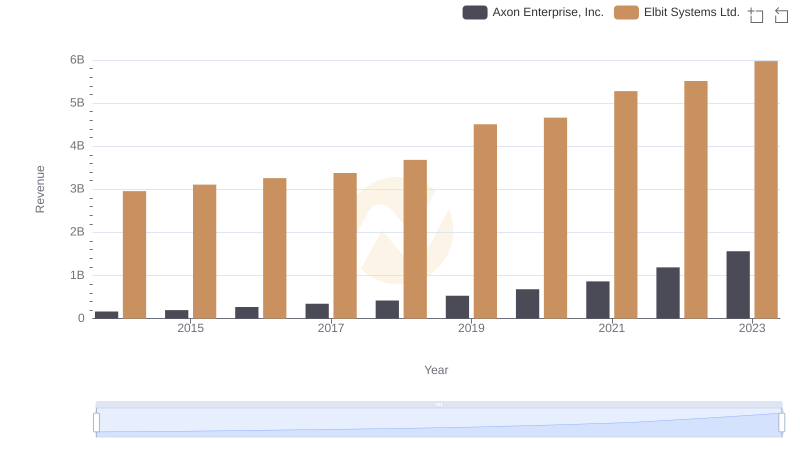
Revenue Insights: Axon Enterprise, Inc. and Elbit Systems Ltd. Performance Compared
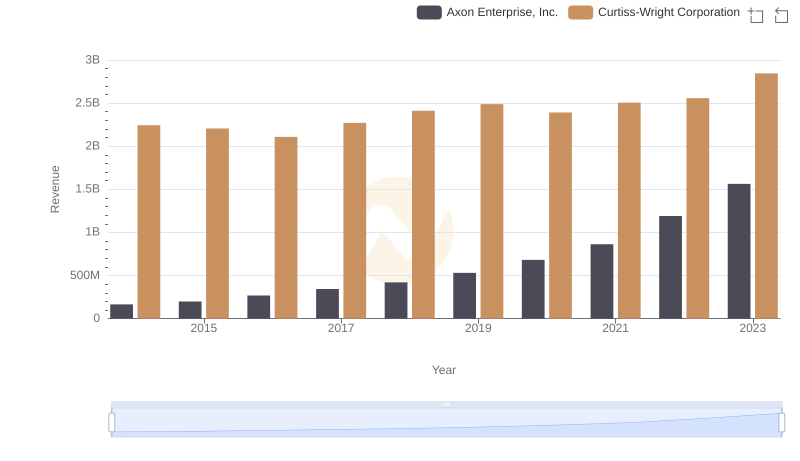
Annual Revenue Comparison: Axon Enterprise, Inc. vs Curtiss-Wright Corporation
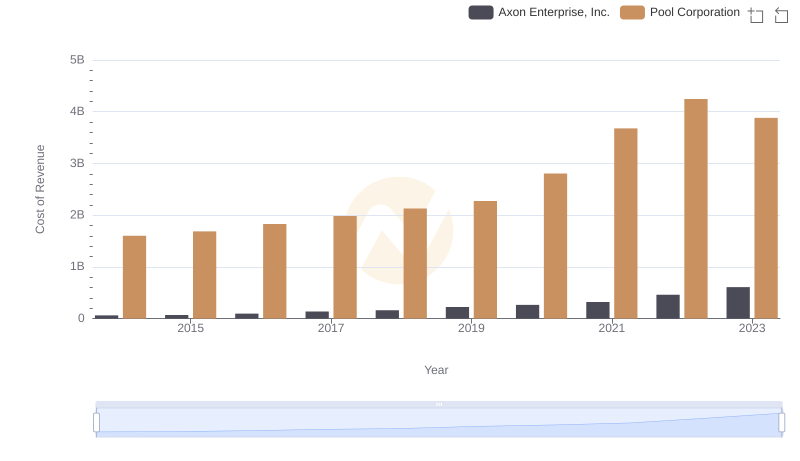
Cost of Revenue Comparison: Axon Enterprise, Inc. vs Pool Corporation
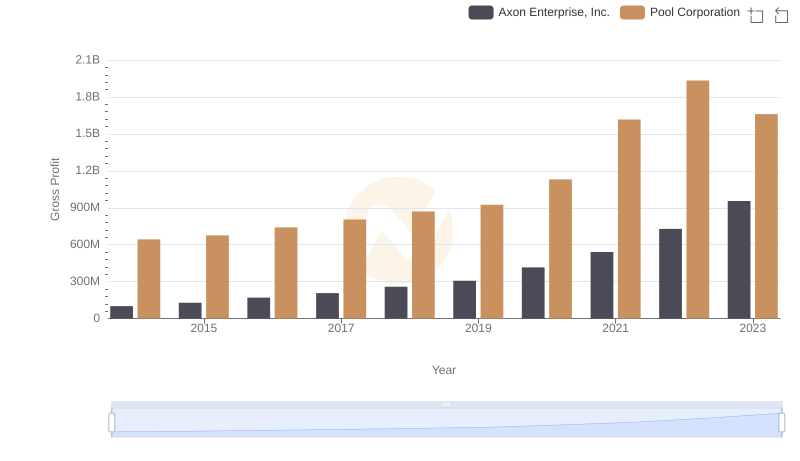
Gross Profit Analysis: Comparing Axon Enterprise, Inc. and Pool Corporation
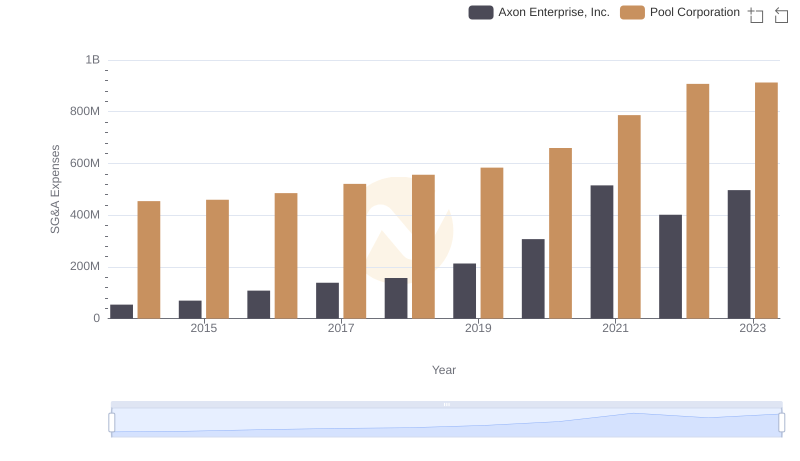
Comparing SG&A Expenses: Axon Enterprise, Inc. vs Pool Corporation Trends and Insights