| __timestamp | Axon Enterprise, Inc. | Masco Corporation |
|---|---|---|
| Wednesday, January 1, 2014 | 54158000 | 1607000000 |
| Thursday, January 1, 2015 | 69698000 | 1339000000 |
| Friday, January 1, 2016 | 108076000 | 1403000000 |
| Sunday, January 1, 2017 | 138692000 | 1442000000 |
| Monday, January 1, 2018 | 156886000 | 1478000000 |
| Tuesday, January 1, 2019 | 212959000 | 1274000000 |
| Wednesday, January 1, 2020 | 307286000 | 1292000000 |
| Friday, January 1, 2021 | 515007000 | 1413000000 |
| Saturday, January 1, 2022 | 401575000 | 1390000000 |
| Sunday, January 1, 2023 | 496874000 | 1481000000 |
| Monday, January 1, 2024 | 1468000000 |
Unlocking the unknown
In the ever-evolving landscape of corporate America, operational efficiency is paramount. Over the past decade, Axon Enterprise, Inc. and Masco Corporation have showcased contrasting trajectories in their Selling, General, and Administrative (SG&A) expenses. From 2014 to 2023, Axon saw a staggering 817% increase in SG&A expenses, reflecting its aggressive growth strategy and expansion into new markets. In contrast, Masco's SG&A expenses remained relatively stable, with a modest 8% increase, highlighting its focus on maintaining operational efficiency.
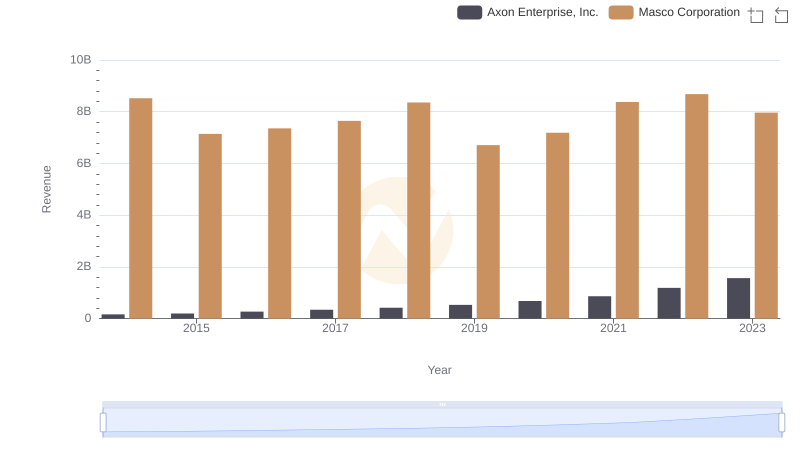
Axon Enterprise, Inc. and Masco Corporation: A Comprehensive Revenue Analysis
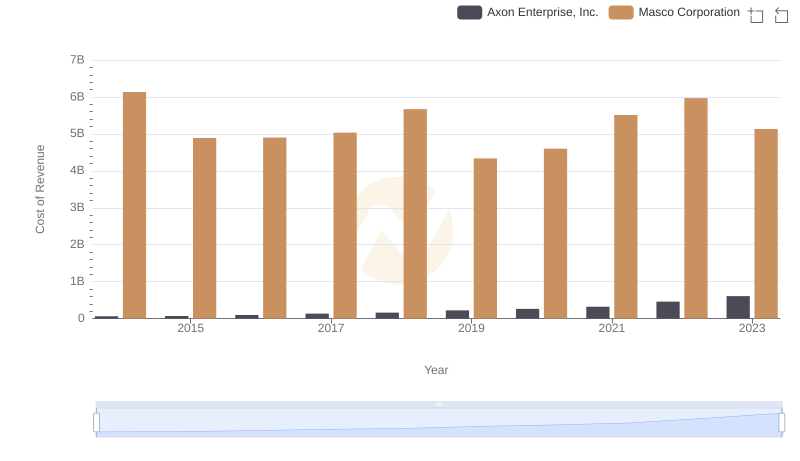
Cost of Revenue Comparison: Axon Enterprise, Inc. vs Masco Corporation
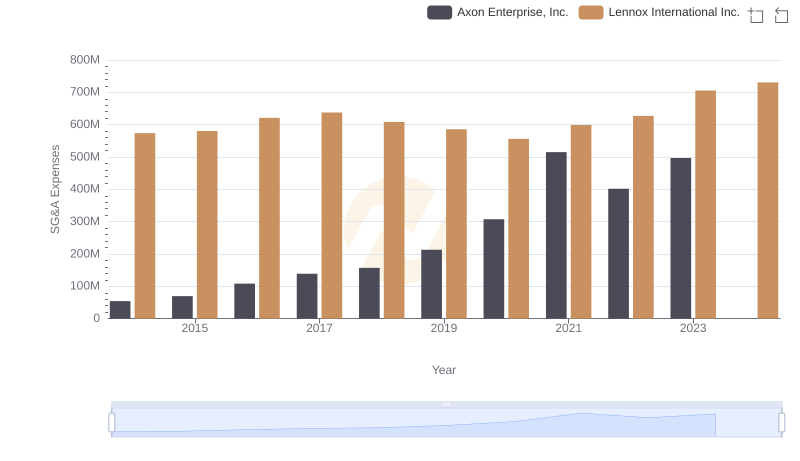
Axon Enterprise, Inc. and Lennox International Inc.: SG&A Spending Patterns Compared
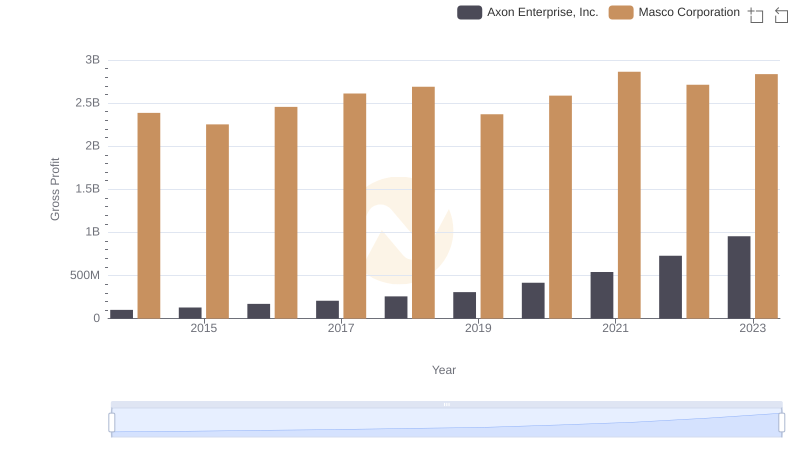
Axon Enterprise, Inc. and Masco Corporation: A Detailed Gross Profit Analysis
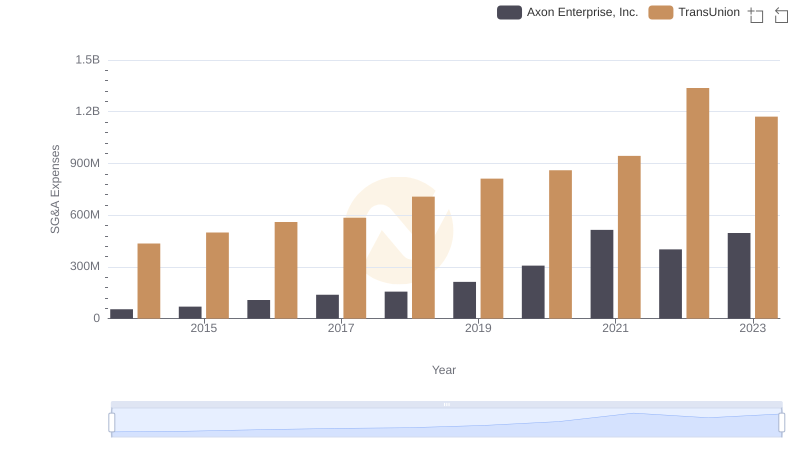
Selling, General, and Administrative Costs: Axon Enterprise, Inc. vs TransUnion
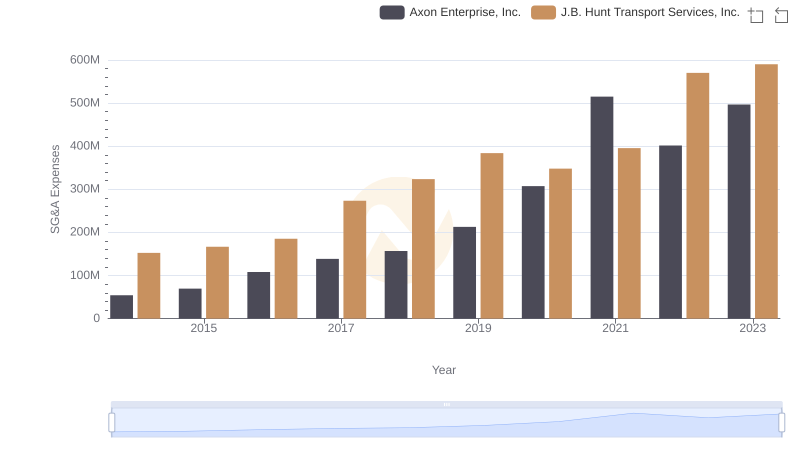
Who Optimizes SG&A Costs Better? Axon Enterprise, Inc. or J.B. Hunt Transport Services, Inc.
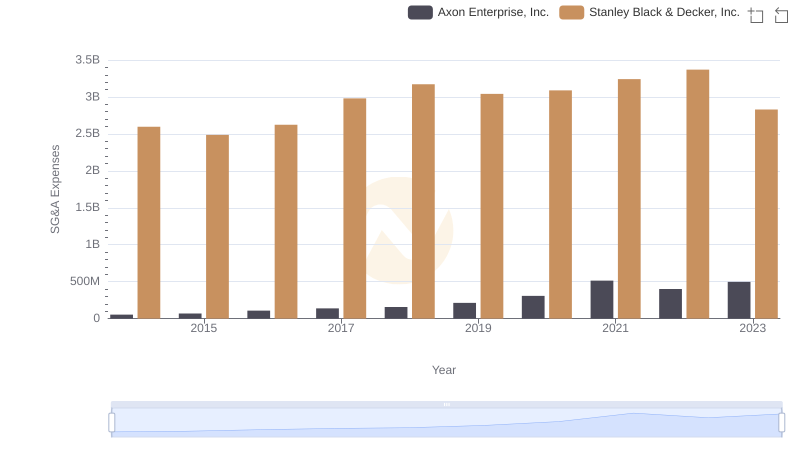
SG&A Efficiency Analysis: Comparing Axon Enterprise, Inc. and Stanley Black & Decker, Inc.
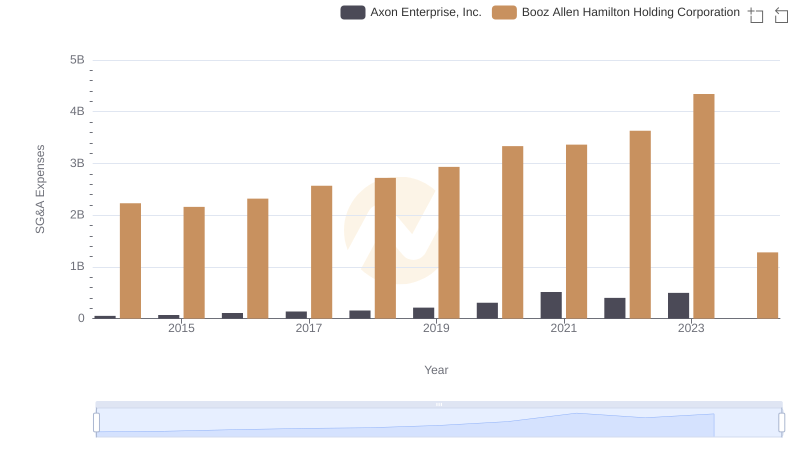
Axon Enterprise, Inc. vs Booz Allen Hamilton Holding Corporation: SG&A Expense Trends
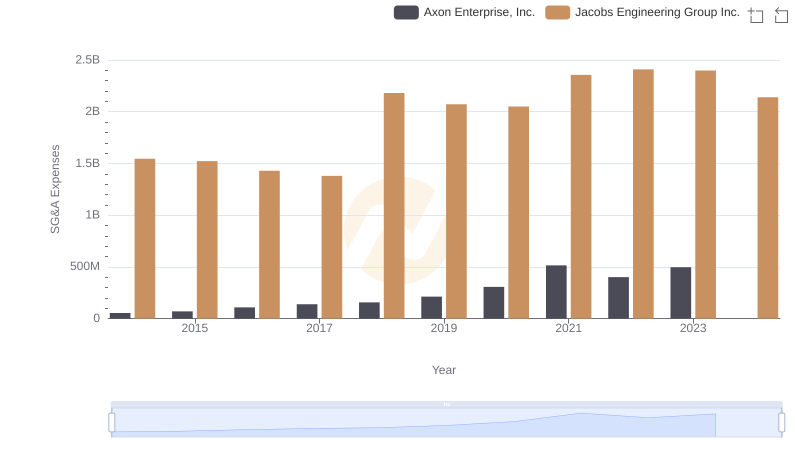
Axon Enterprise, Inc. and Jacobs Engineering Group Inc.: SG&A Spending Patterns Compared
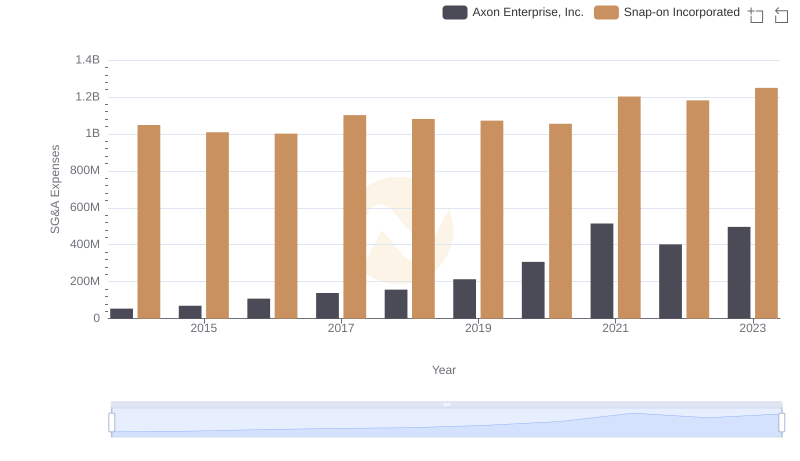
Axon Enterprise, Inc. or Snap-on Incorporated: Who Manages SG&A Costs Better?
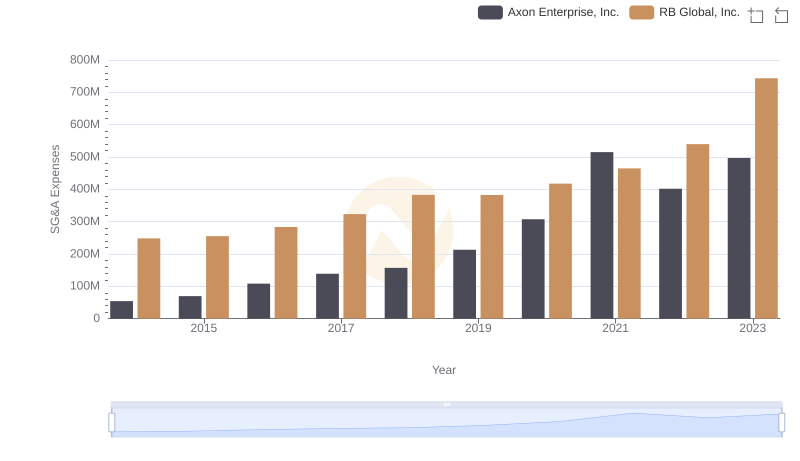
Axon Enterprise, Inc. vs RB Global, Inc.: SG&A Expense Trends
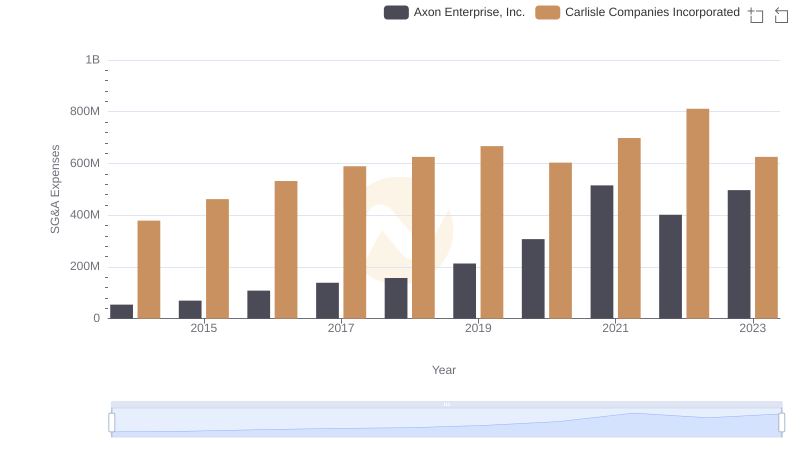
Breaking Down SG&A Expenses: Axon Enterprise, Inc. vs Carlisle Companies Incorporated