| __timestamp | Axon Enterprise, Inc. | Masco Corporation |
|---|---|---|
| Wednesday, January 1, 2014 | 164525000 | 8521000000 |
| Thursday, January 1, 2015 | 197892000 | 7142000000 |
| Friday, January 1, 2016 | 268245000 | 7357000000 |
| Sunday, January 1, 2017 | 343798000 | 7644000000 |
| Monday, January 1, 2018 | 420068000 | 8359000000 |
| Tuesday, January 1, 2019 | 530860000 | 6707000000 |
| Wednesday, January 1, 2020 | 681003000 | 7188000000 |
| Friday, January 1, 2021 | 863381000 | 8375000000 |
| Saturday, January 1, 2022 | 1189935000 | 8680000000 |
| Sunday, January 1, 2023 | 1563391000 | 7967000000 |
| Monday, January 1, 2024 | 7828000000 |
Unleashing insights
In the dynamic landscape of American business, Axon Enterprise, Inc. and Masco Corporation have showcased intriguing revenue trajectories from 2014 to 2023. Axon, a leader in public safety technology, has experienced a remarkable revenue surge, growing nearly tenfold over the decade. Starting at approximately $165 million in 2014, Axon's revenue soared to over $1.56 billion by 2023, reflecting a robust annual growth rate of around 30%.
Conversely, Masco Corporation, a stalwart in home improvement and building products, displayed a more stable revenue pattern. Despite fluctuations, Masco's revenue remained consistently high, peaking at $8.68 billion in 2022. However, a slight dip to $7.97 billion in 2023 suggests potential market challenges.
This comparative analysis highlights Axon's aggressive growth strategy and Masco's steady market presence, offering valuable insights into their respective industries.
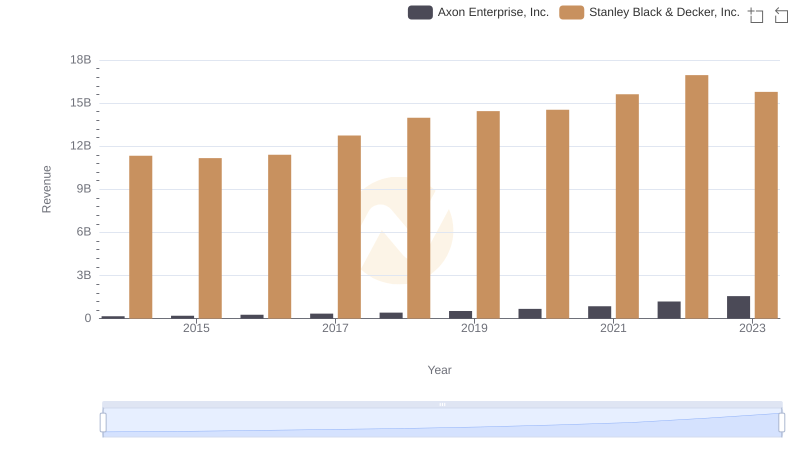
Revenue Showdown: Axon Enterprise, Inc. vs Stanley Black & Decker, Inc.
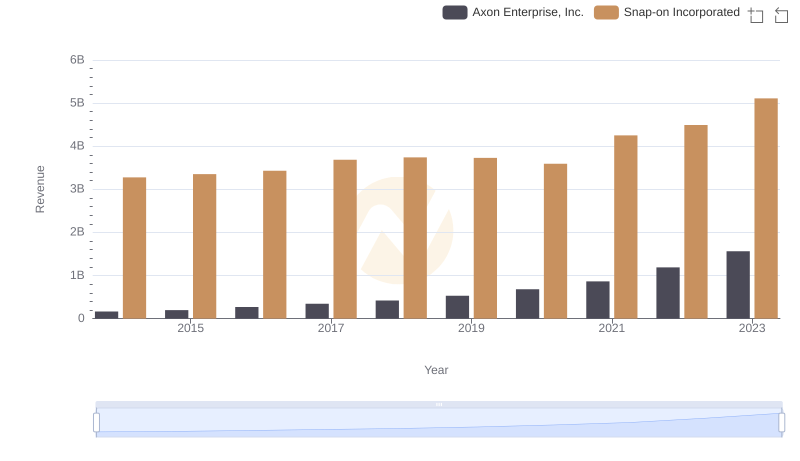
Axon Enterprise, Inc. vs Snap-on Incorporated: Examining Key Revenue Metrics
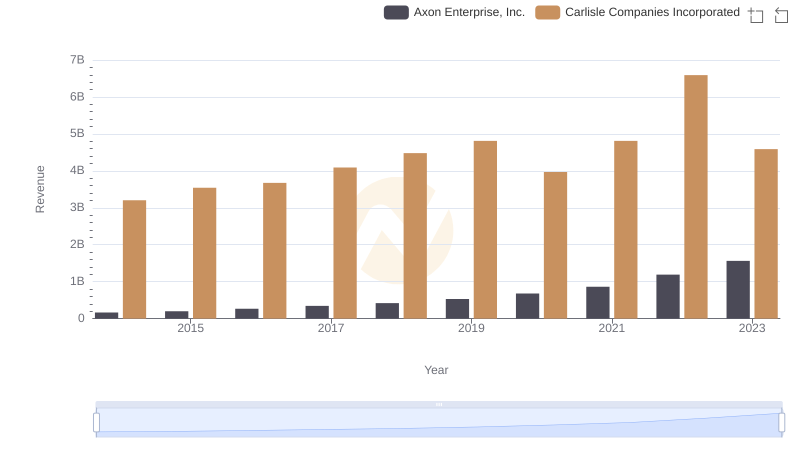
Axon Enterprise, Inc. and Carlisle Companies Incorporated: A Comprehensive Revenue Analysis
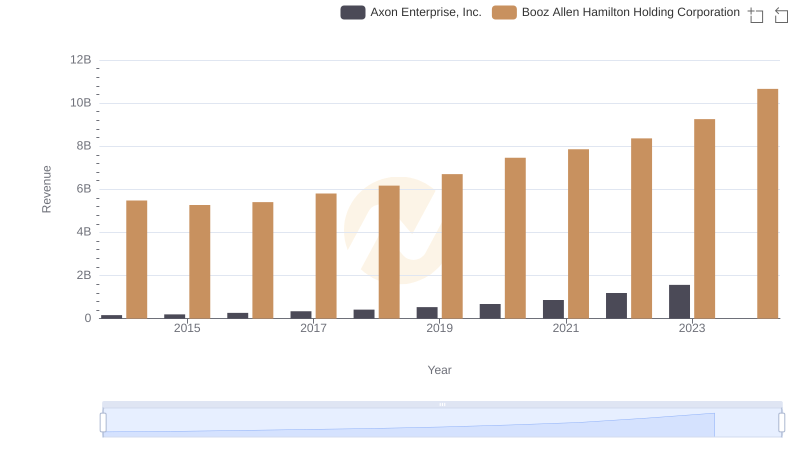
Annual Revenue Comparison: Axon Enterprise, Inc. vs Booz Allen Hamilton Holding Corporation
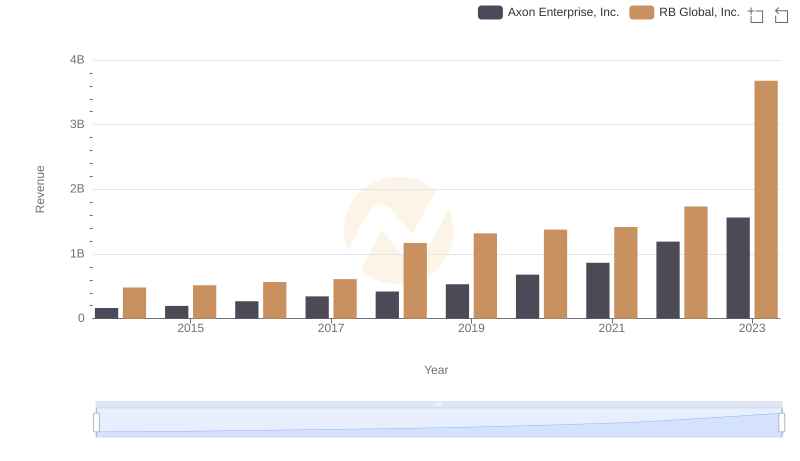
Revenue Insights: Axon Enterprise, Inc. and RB Global, Inc. Performance Compared
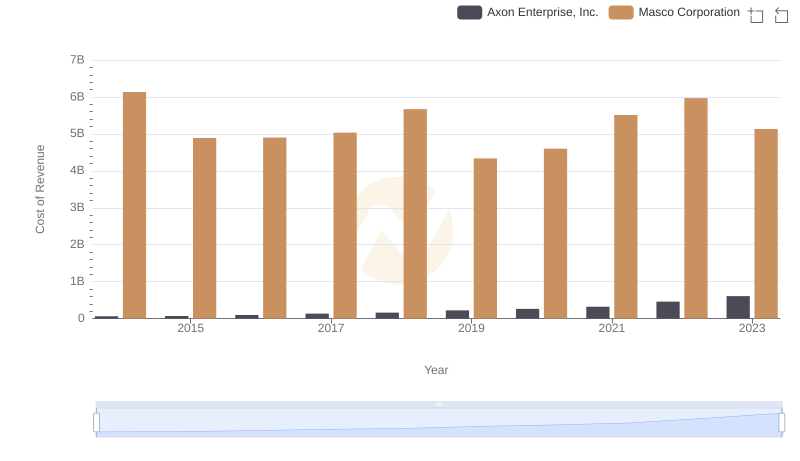
Cost of Revenue Comparison: Axon Enterprise, Inc. vs Masco Corporation

Axon Enterprise, Inc. vs IDEX Corporation: Examining Key Revenue Metrics
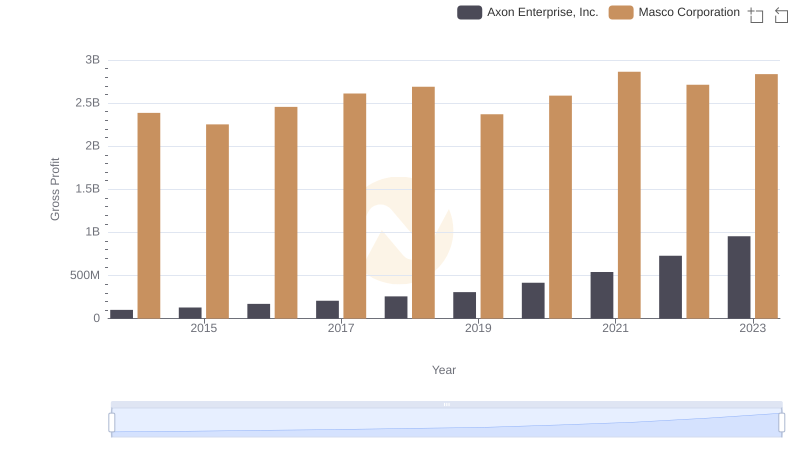
Axon Enterprise, Inc. and Masco Corporation: A Detailed Gross Profit Analysis
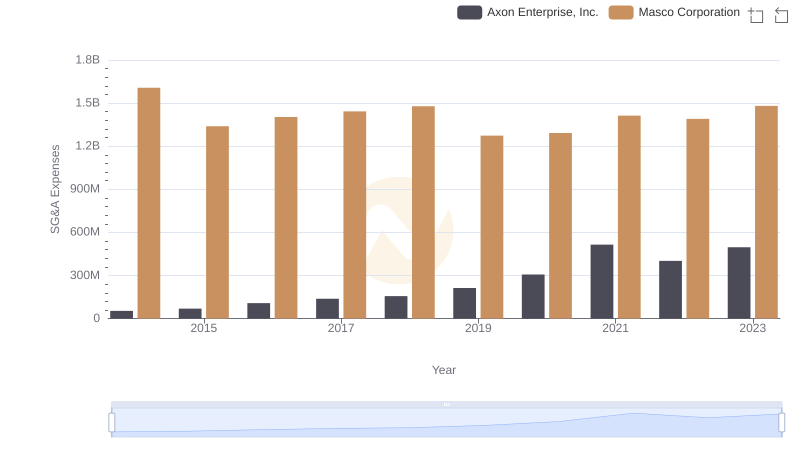
Operational Costs Compared: SG&A Analysis of Axon Enterprise, Inc. and Masco Corporation