| __timestamp | Intuit Inc. | PTC Inc. |
|---|---|---|
| Wednesday, January 1, 2014 | 1762000000 | 499679000 |
| Thursday, January 1, 2015 | 1771000000 | 557301000 |
| Friday, January 1, 2016 | 1807000000 | 513080000 |
| Sunday, January 1, 2017 | 1973000000 | 518013000 |
| Monday, January 1, 2018 | 2298000000 | 557505000 |
| Tuesday, January 1, 2019 | 2524000000 | 545368000 |
| Wednesday, January 1, 2020 | 2727000000 | 595277000 |
| Friday, January 1, 2021 | 3626000000 | 723785000 |
| Saturday, January 1, 2022 | 4986000000 | 689979000 |
| Sunday, January 1, 2023 | 5062000000 | 763641000 |
| Monday, January 1, 2024 | 5730000000 | 791331000 |
Unveiling the hidden dimensions of data
In the ever-evolving landscape of corporate finance, understanding the nuances of Selling, General, and Administrative (SG&A) expenses is crucial. Over the past decade, Intuit Inc. and PTC Inc. have demonstrated contrasting trajectories in their SG&A expenditures. From 2014 to 2024, Intuit's SG&A costs surged by over 225%, reflecting its aggressive growth strategy and market expansion. In contrast, PTC Inc. experienced a more modest increase of approximately 58%, indicating a more conservative approach.
By 2024, Intuit's SG&A expenses reached nearly 7 times that of PTC, highlighting its significant investment in operational capabilities. This divergence underscores the strategic priorities of each company, with Intuit focusing on scaling operations and PTC maintaining a leaner structure. As businesses navigate the complexities of the modern economy, these insights offer valuable lessons in balancing growth with operational efficiency.
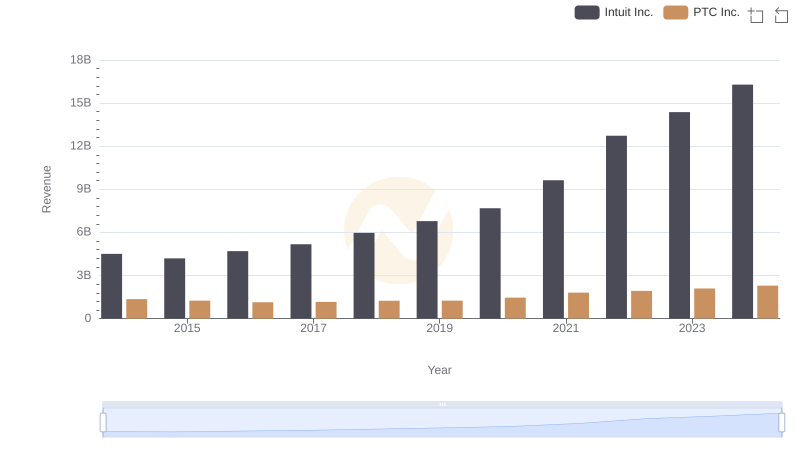
Annual Revenue Comparison: Intuit Inc. vs PTC Inc.
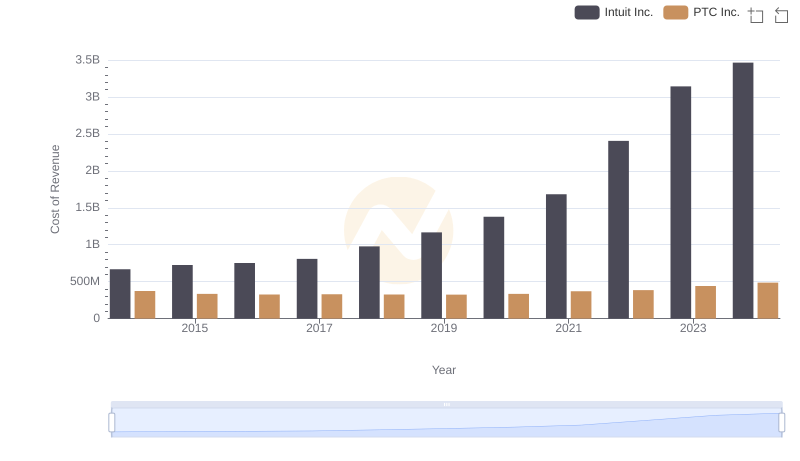
Cost of Revenue: Key Insights for Intuit Inc. and PTC Inc.
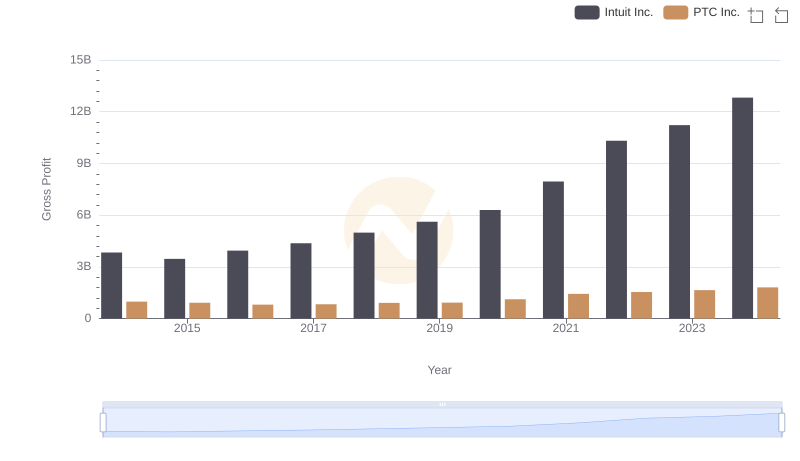
Gross Profit Analysis: Comparing Intuit Inc. and PTC Inc.
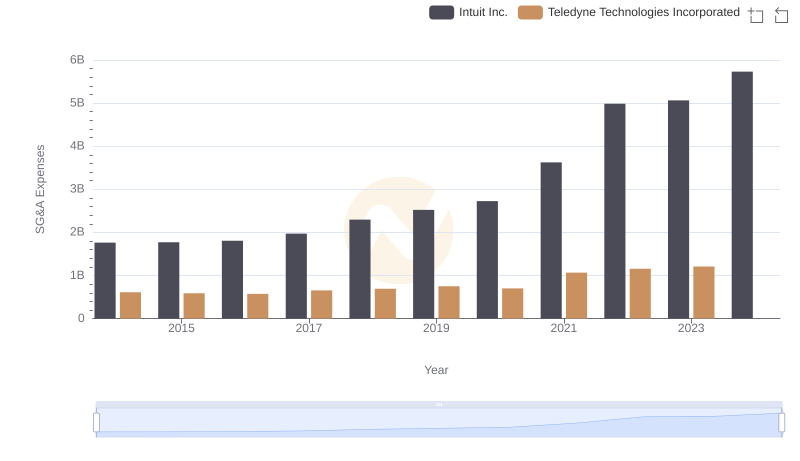
Breaking Down SG&A Expenses: Intuit Inc. vs Teledyne Technologies Incorporated
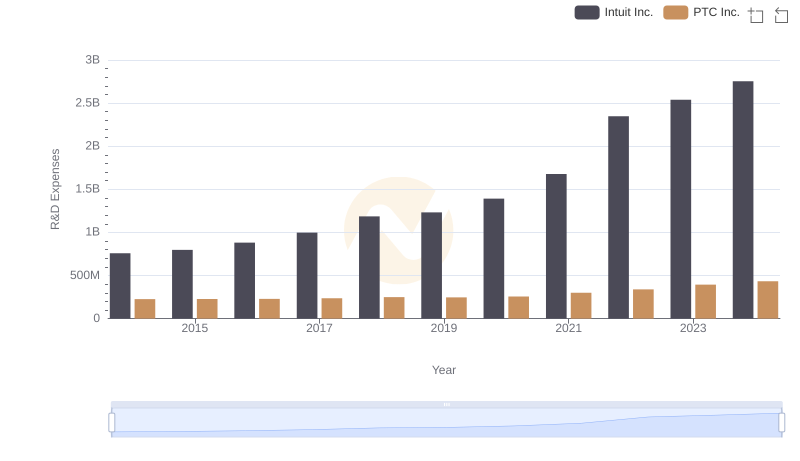
Who Prioritizes Innovation? R&D Spending Compared for Intuit Inc. and PTC Inc.
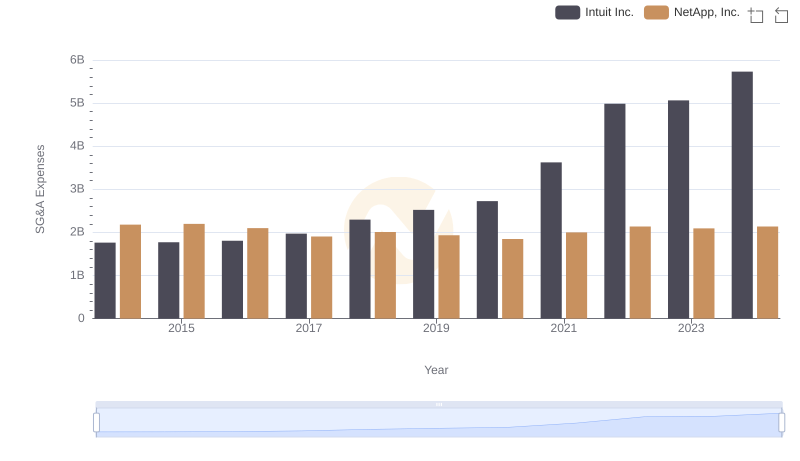
Intuit Inc. or NetApp, Inc.: Who Manages SG&A Costs Better?
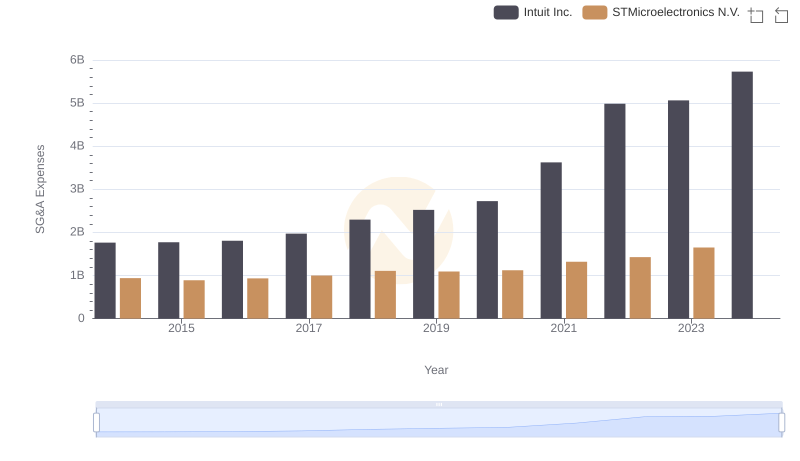
Cost Management Insights: SG&A Expenses for Intuit Inc. and STMicroelectronics N.V.
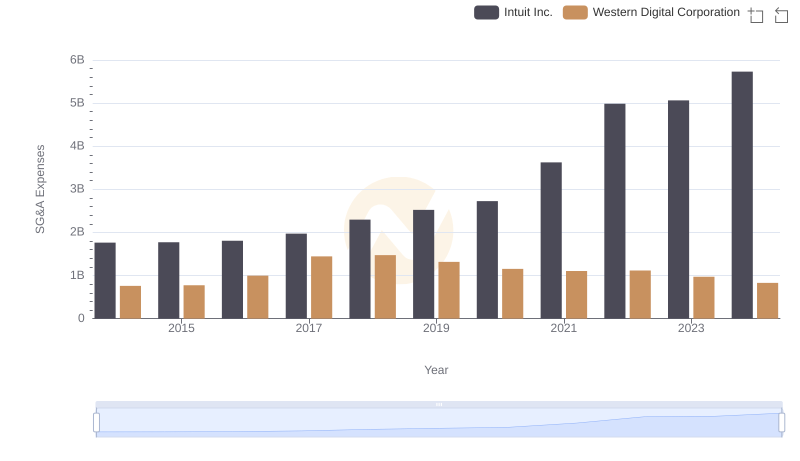
Intuit Inc. or Western Digital Corporation: Who Manages SG&A Costs Better?
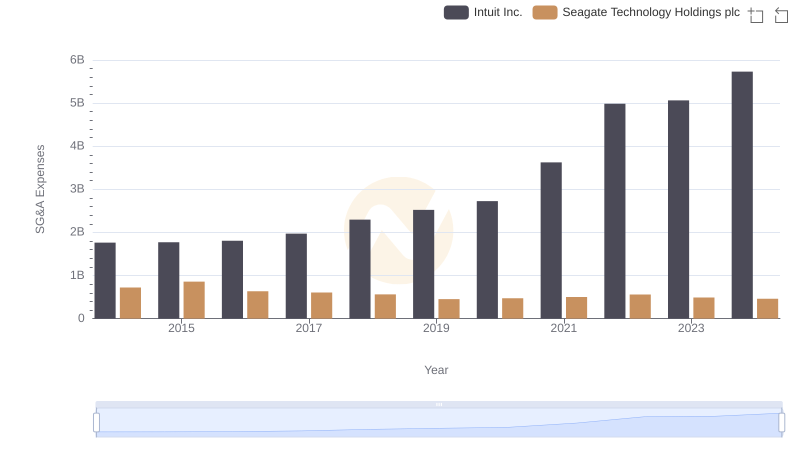
Cost Management Insights: SG&A Expenses for Intuit Inc. and Seagate Technology Holdings plc
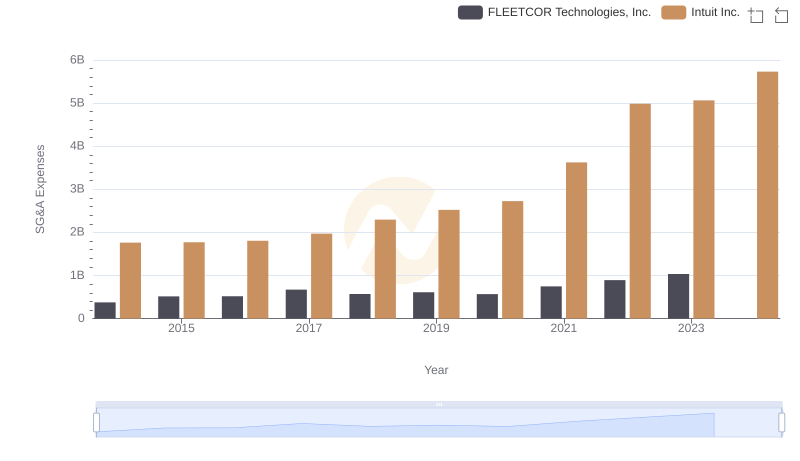
Comparing SG&A Expenses: Intuit Inc. vs FLEETCOR Technologies, Inc. Trends and Insights
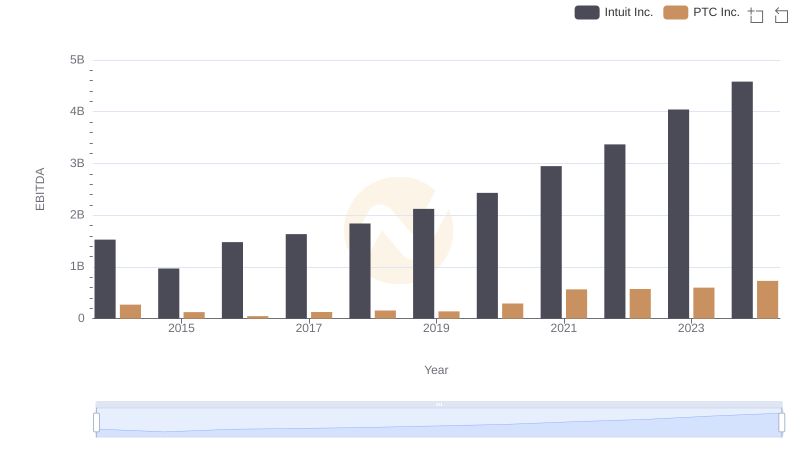
Intuit Inc. vs PTC Inc.: In-Depth EBITDA Performance Comparison