| __timestamp | Cintas Corporation | United Rentals, Inc. |
|---|---|---|
| Wednesday, January 1, 2014 | 1302752000 | 758000000 |
| Thursday, January 1, 2015 | 1224930000 | 714000000 |
| Friday, January 1, 2016 | 1348122000 | 719000000 |
| Sunday, January 1, 2017 | 1527380000 | 903000000 |
| Monday, January 1, 2018 | 1916792000 | 1038000000 |
| Tuesday, January 1, 2019 | 1980644000 | 1092000000 |
| Wednesday, January 1, 2020 | 2071052000 | 979000000 |
| Friday, January 1, 2021 | 1929159000 | 1199000000 |
| Saturday, January 1, 2022 | 2044876000 | 1400000000 |
| Sunday, January 1, 2023 | 2370704000 | 1527000000 |
| Monday, January 1, 2024 | 2617783000 | 1645000000 |
Data in motion
In the competitive landscape of corporate America, effective cost management is crucial. Cintas Corporation and United Rentals, Inc. have demonstrated distinct trajectories in their Selling, General, and Administrative (SG&A) expenses over the past decade. From 2014 to 2024, Cintas saw a remarkable 101% increase in SG&A expenses, reflecting strategic investments and expansion efforts. In contrast, United Rentals experienced a 117% rise, indicating robust growth and operational scaling.
Cintas began 2014 with SG&A expenses of approximately $1.3 billion, climbing steadily to over $2.6 billion by 2024. United Rentals, starting at $758 million, reached $1.6 billion in the same period. This upward trend highlights the dynamic nature of these industries, where strategic spending is pivotal for maintaining competitive advantage. As we delve into these insights, it becomes evident that managing SG&A expenses is not just about cost-cutting but about fueling growth and innovation.
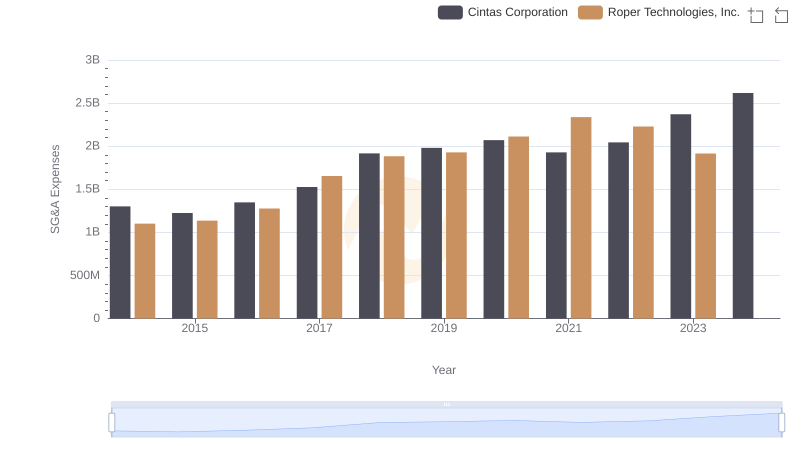
Comparing SG&A Expenses: Cintas Corporation vs Roper Technologies, Inc. Trends and Insights
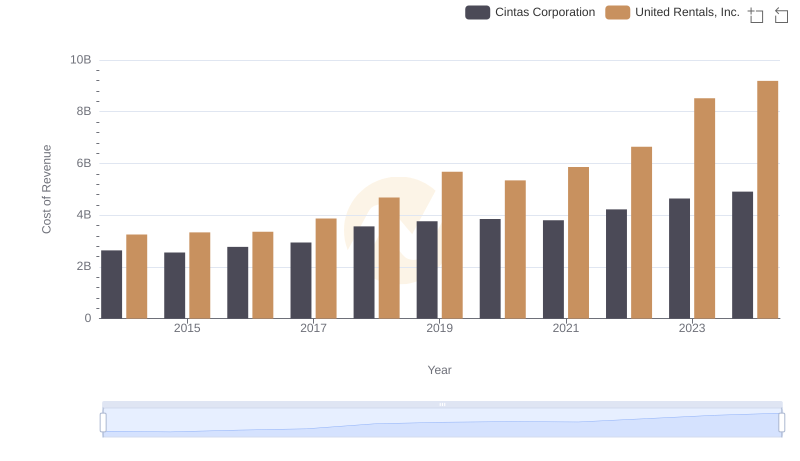
Comparing Cost of Revenue Efficiency: Cintas Corporation vs United Rentals, Inc.
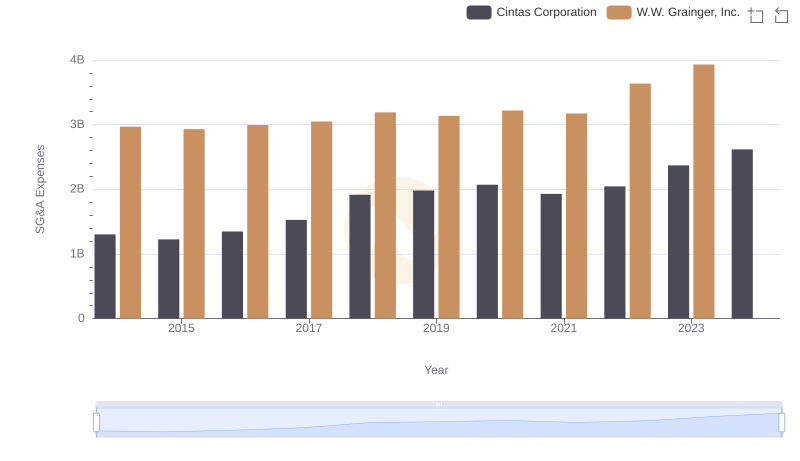
Cintas Corporation vs W.W. Grainger, Inc.: SG&A Expense Trends
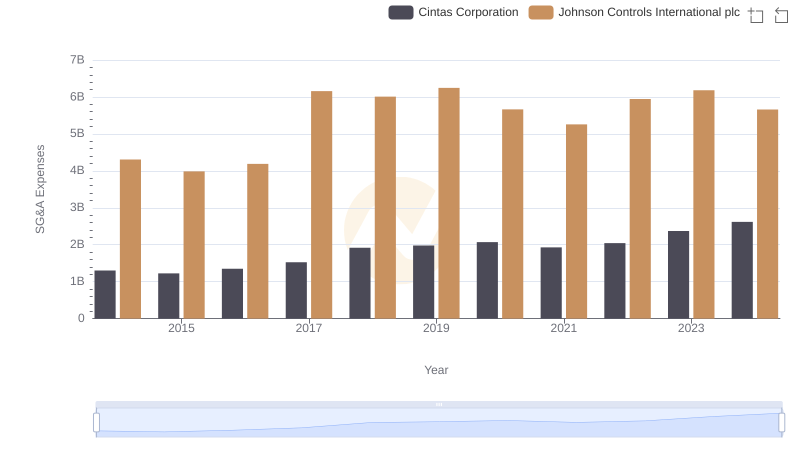
Cintas Corporation and Johnson Controls International plc: SG&A Spending Patterns Compared
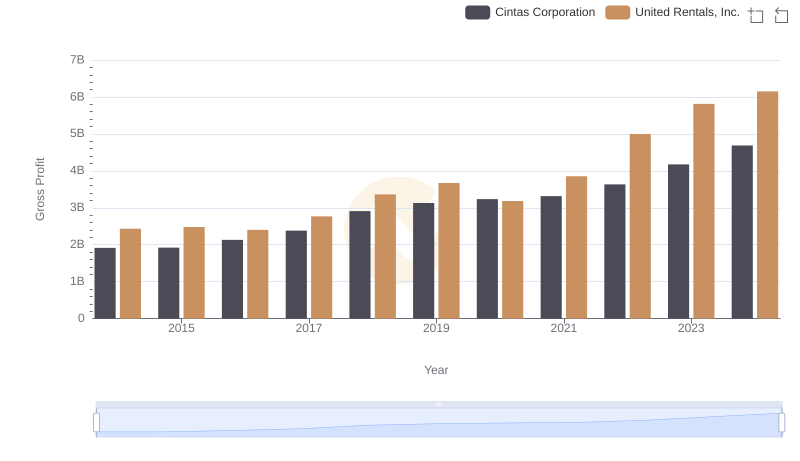
Gross Profit Analysis: Comparing Cintas Corporation and United Rentals, Inc.
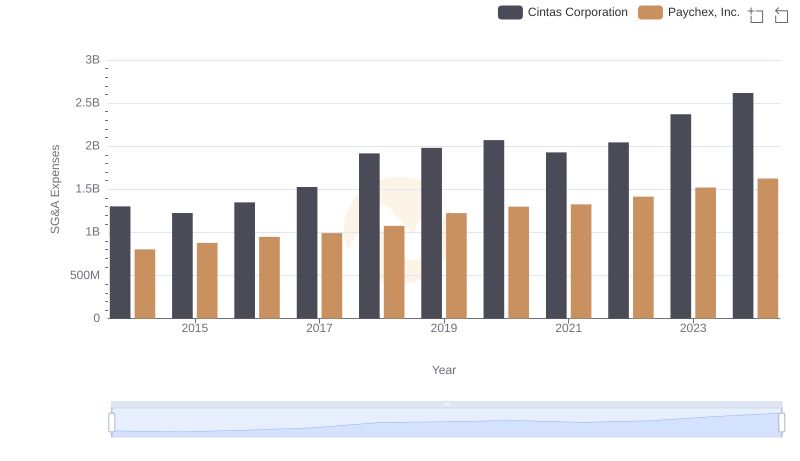
Comparing SG&A Expenses: Cintas Corporation vs Paychex, Inc. Trends and Insights
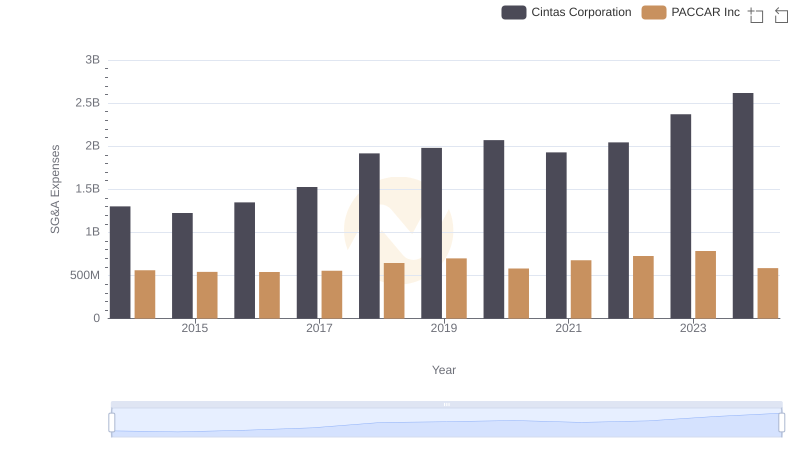
Cost Management Insights: SG&A Expenses for Cintas Corporation and PACCAR Inc
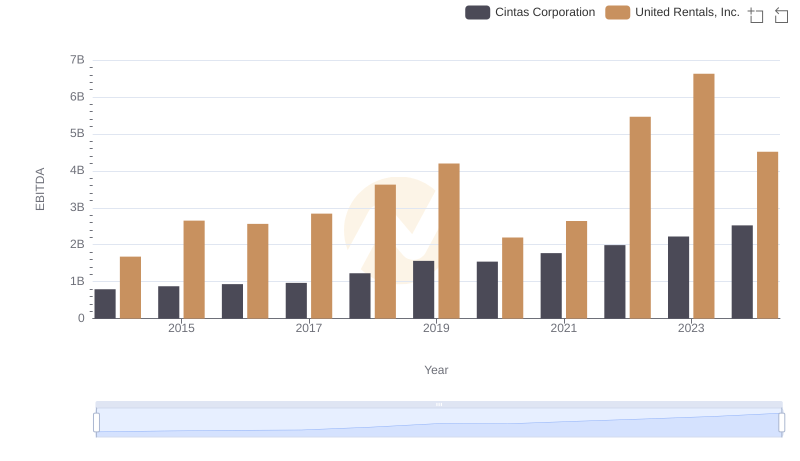
Comprehensive EBITDA Comparison: Cintas Corporation vs United Rentals, Inc.
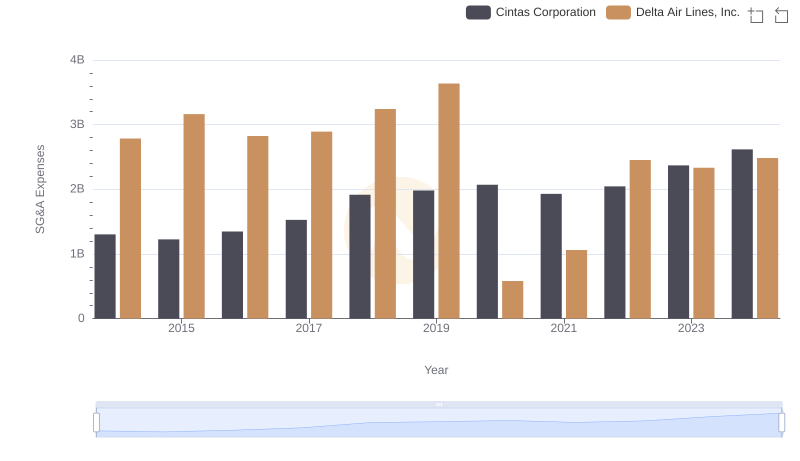
Cost Management Insights: SG&A Expenses for Cintas Corporation and Delta Air Lines, Inc.
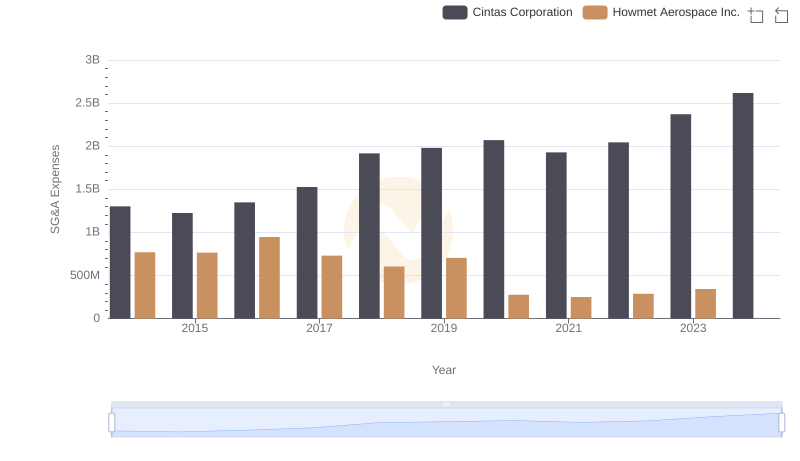
Who Optimizes SG&A Costs Better? Cintas Corporation or Howmet Aerospace Inc.
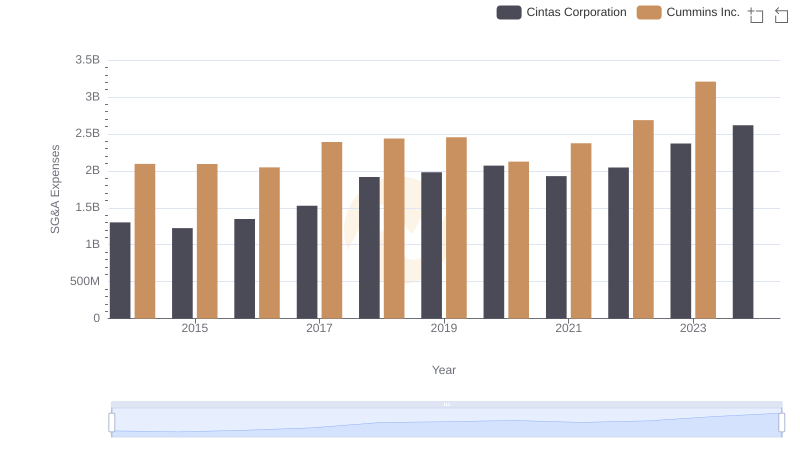
Breaking Down SG&A Expenses: Cintas Corporation vs Cummins Inc.