| __timestamp | Cintas Corporation | W.W. Grainger, Inc. |
|---|---|---|
| Wednesday, January 1, 2014 | 1302752000 | 2967125000 |
| Thursday, January 1, 2015 | 1224930000 | 2931108000 |
| Friday, January 1, 2016 | 1348122000 | 2995060000 |
| Sunday, January 1, 2017 | 1527380000 | 3048895000 |
| Monday, January 1, 2018 | 1916792000 | 3190000000 |
| Tuesday, January 1, 2019 | 1980644000 | 3135000000 |
| Wednesday, January 1, 2020 | 2071052000 | 3219000000 |
| Friday, January 1, 2021 | 1929159000 | 3173000000 |
| Saturday, January 1, 2022 | 2044876000 | 3634000000 |
| Sunday, January 1, 2023 | 2370704000 | 3931000000 |
| Monday, January 1, 2024 | 2617783000 | 4121000000 |
Cracking the code
In the competitive landscape of business services, understanding the trends in Selling, General, and Administrative (SG&A) expenses is crucial. Over the past decade, Cintas Corporation and W.W. Grainger, Inc. have shown distinct trajectories in their SG&A expenses. From 2014 to 2023, Cintas Corporation's SG&A expenses have surged by approximately 101%, reflecting its strategic investments and expansion efforts. In contrast, W.W. Grainger, Inc. experienced a more modest increase of around 32% over the same period, indicating a more conservative approach to cost management.
Interestingly, in 2023, W.W. Grainger, Inc. reported its highest SG&A expenses, marking a 24% increase from the previous year, while Cintas Corporation's expenses rose by 15%. The data for 2024 is incomplete, highlighting the need for ongoing analysis. These trends offer valuable insights into each company's operational strategies and market positioning.
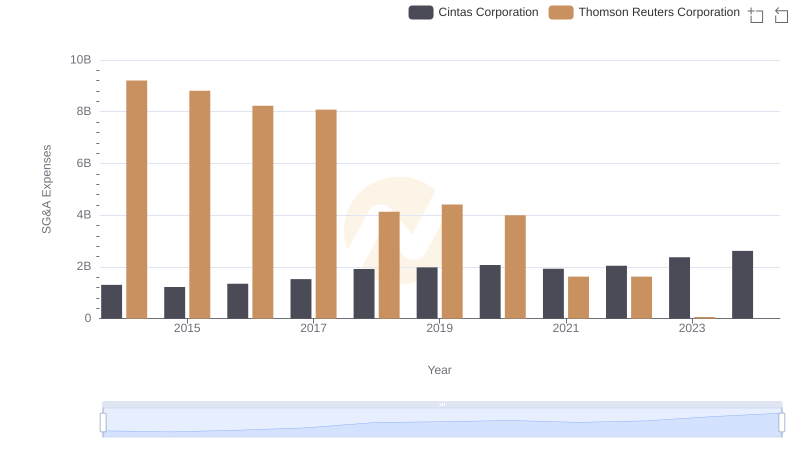
Cost Management Insights: SG&A Expenses for Cintas Corporation and Thomson Reuters Corporation
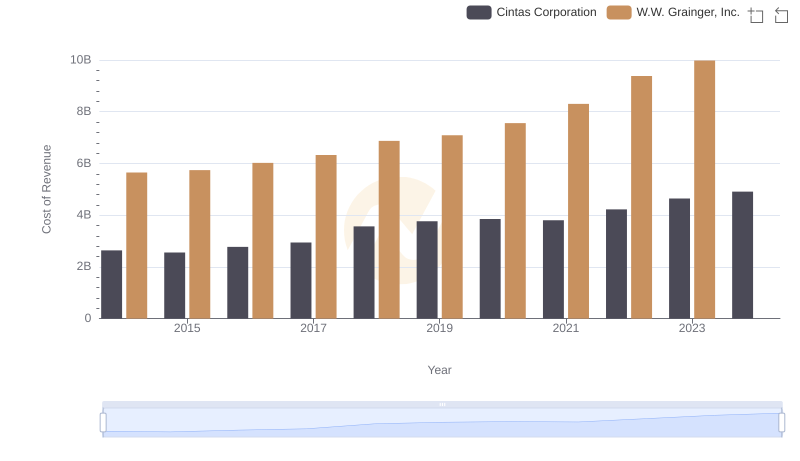
Cintas Corporation vs W.W. Grainger, Inc.: Efficiency in Cost of Revenue Explored
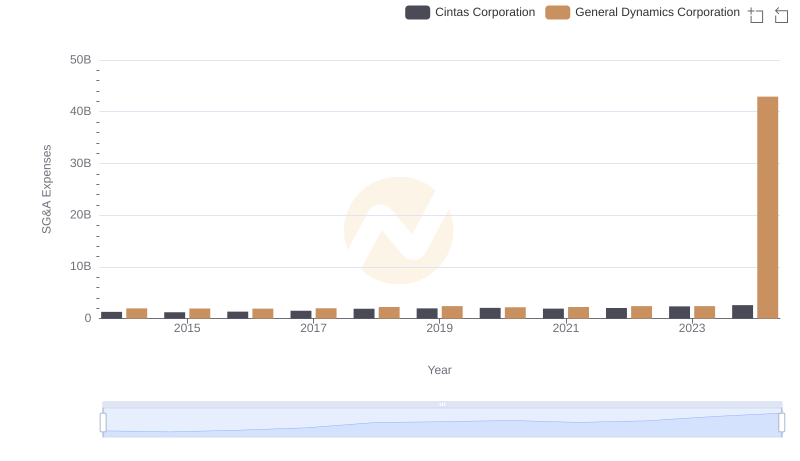
Comparing SG&A Expenses: Cintas Corporation vs General Dynamics Corporation Trends and Insights
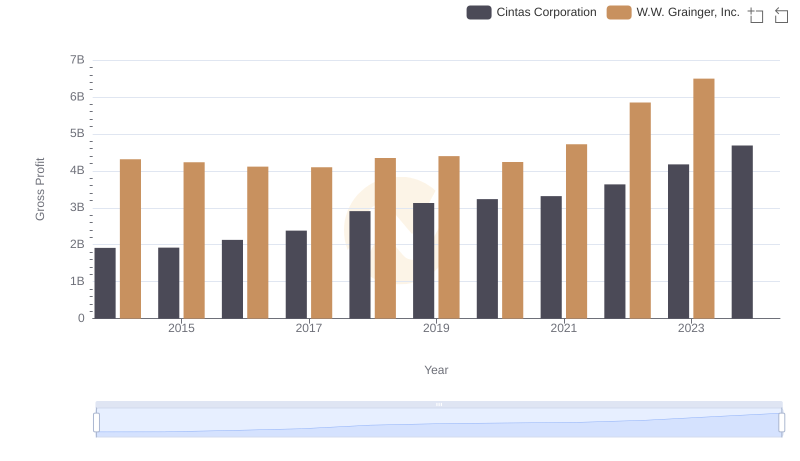
Who Generates Higher Gross Profit? Cintas Corporation or W.W. Grainger, Inc.
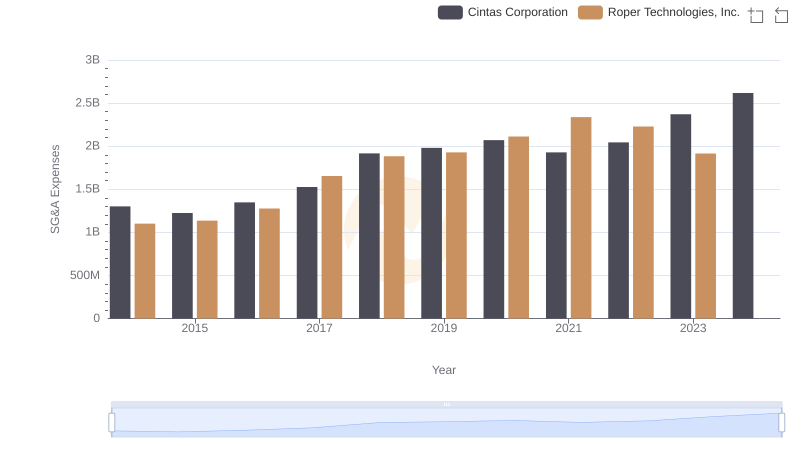
Comparing SG&A Expenses: Cintas Corporation vs Roper Technologies, Inc. Trends and Insights
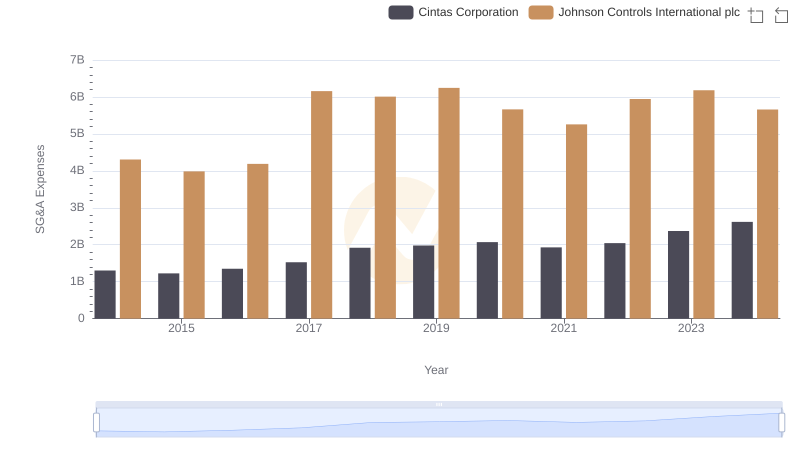
Cintas Corporation and Johnson Controls International plc: SG&A Spending Patterns Compared
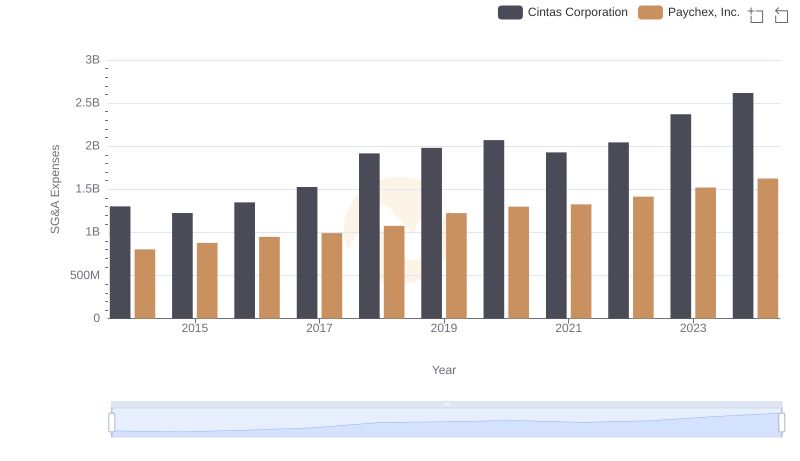
Comparing SG&A Expenses: Cintas Corporation vs Paychex, Inc. Trends and Insights
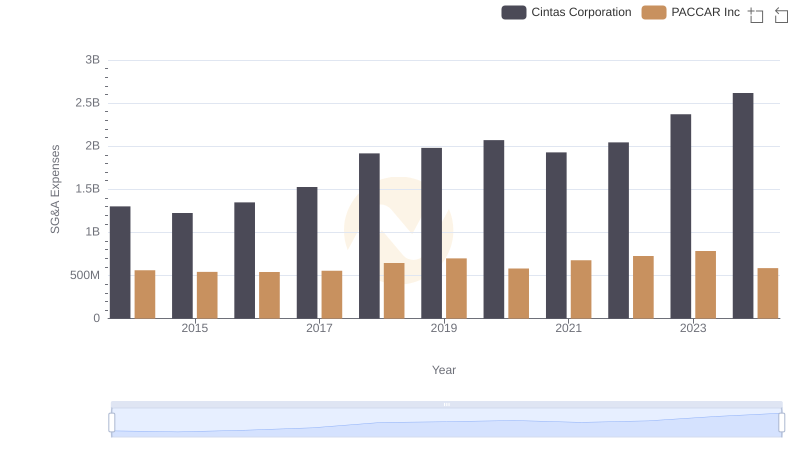
Cost Management Insights: SG&A Expenses for Cintas Corporation and PACCAR Inc
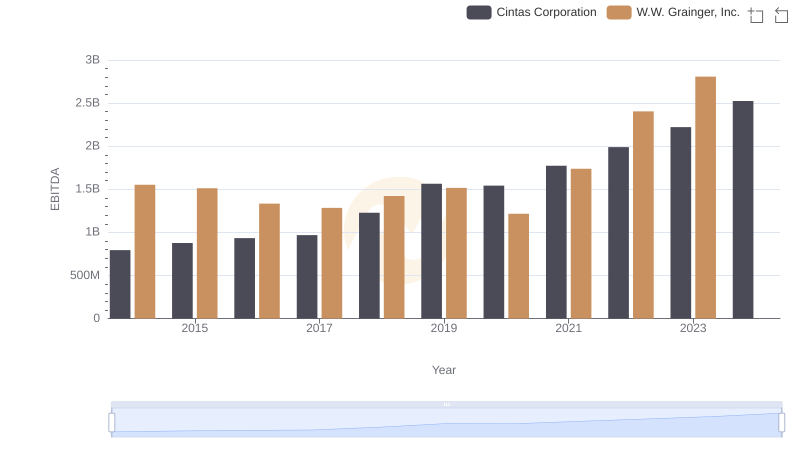
Cintas Corporation vs W.W. Grainger, Inc.: In-Depth EBITDA Performance Comparison
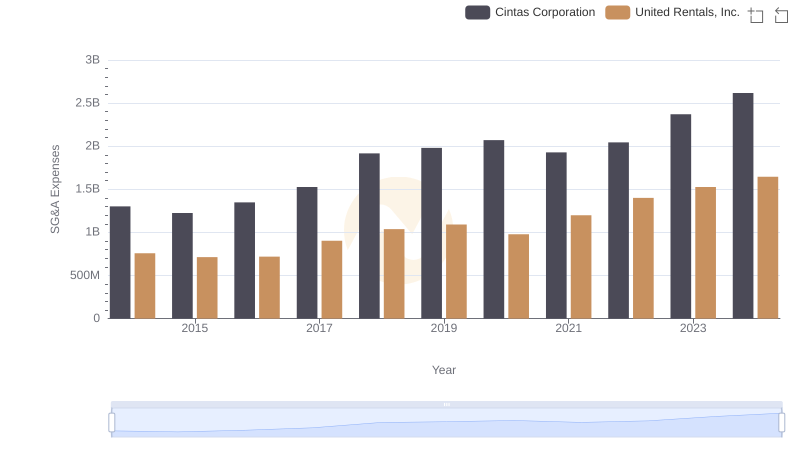
Cost Management Insights: SG&A Expenses for Cintas Corporation and United Rentals, Inc.