| __timestamp | Cintas Corporation | Roper Technologies, Inc. |
|---|---|---|
| Wednesday, January 1, 2014 | 1302752000 | 1102426000 |
| Thursday, January 1, 2015 | 1224930000 | 1136728000 |
| Friday, January 1, 2016 | 1348122000 | 1277847000 |
| Sunday, January 1, 2017 | 1527380000 | 1654552000 |
| Monday, January 1, 2018 | 1916792000 | 1883100000 |
| Tuesday, January 1, 2019 | 1980644000 | 1928700000 |
| Wednesday, January 1, 2020 | 2071052000 | 2111900000 |
| Friday, January 1, 2021 | 1929159000 | 2337700000 |
| Saturday, January 1, 2022 | 2044876000 | 2228300000 |
| Sunday, January 1, 2023 | 2370704000 | 1915900000 |
| Monday, January 1, 2024 | 2617783000 | 2881500000 |
Igniting the spark of knowledge
In the competitive landscape of corporate America, understanding the financial strategies of industry leaders is crucial. Cintas Corporation and Roper Technologies, Inc. have been at the forefront of innovation and efficiency. From 2014 to 2023, Cintas Corporation's Selling, General, and Administrative (SG&A) expenses have shown a remarkable upward trend, increasing by approximately 101% over the decade. In contrast, Roper Technologies, Inc. experienced a more modest growth of around 74% in the same period.
Cintas Corporation's SG&A expenses peaked in 2024, reflecting a strategic expansion or investment phase. Meanwhile, Roper Technologies, Inc. saw a decline in 2023, possibly indicating a shift in operational focus or cost optimization efforts. The absence of data for Roper in 2024 suggests a potential restructuring or reporting change. These trends highlight the dynamic nature of financial management in large corporations, offering valuable insights for investors and analysts alike.
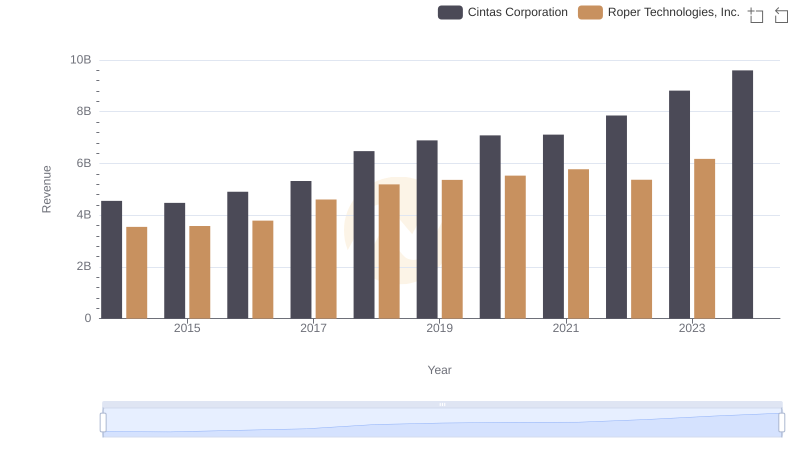
Comparing Revenue Performance: Cintas Corporation or Roper Technologies, Inc.?
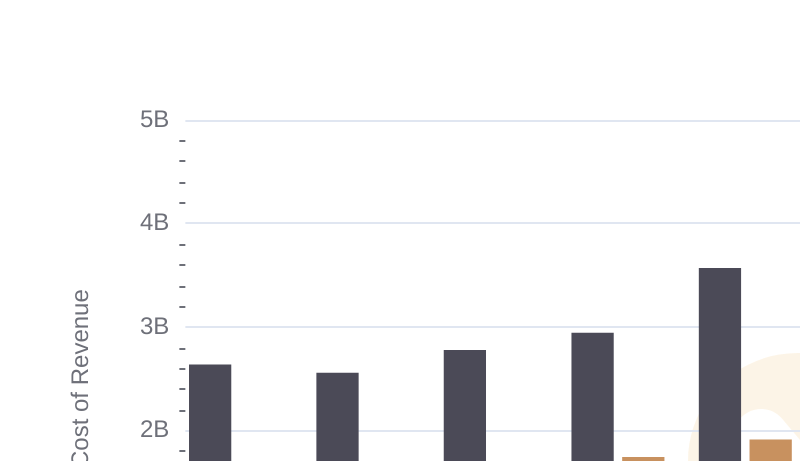
Cost of Revenue Comparison: Cintas Corporation vs Roper Technologies, Inc.

Cost Management Insights: SG&A Expenses for Cintas Corporation and Republic Services, Inc.
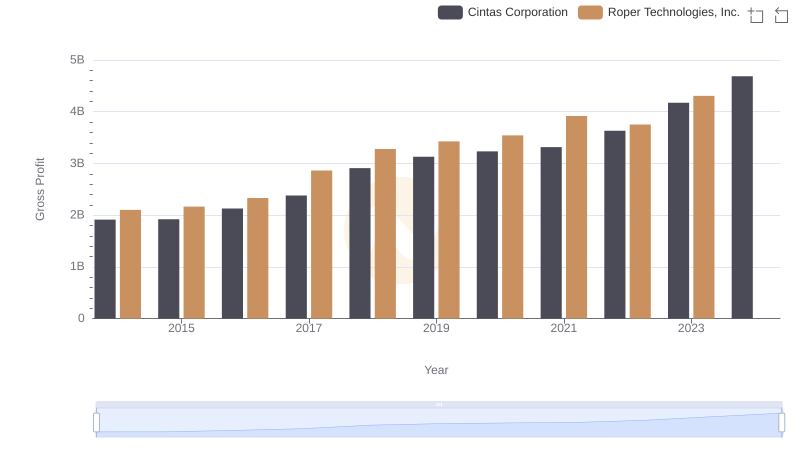
Key Insights on Gross Profit: Cintas Corporation vs Roper Technologies, Inc.
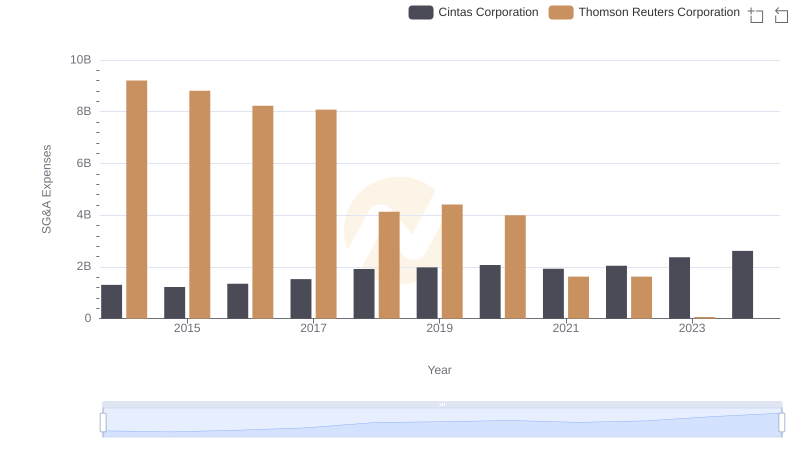
Cost Management Insights: SG&A Expenses for Cintas Corporation and Thomson Reuters Corporation
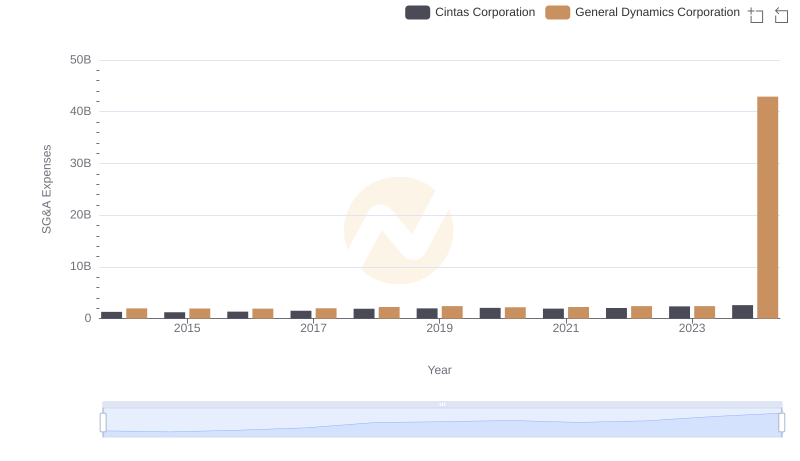
Comparing SG&A Expenses: Cintas Corporation vs General Dynamics Corporation Trends and Insights
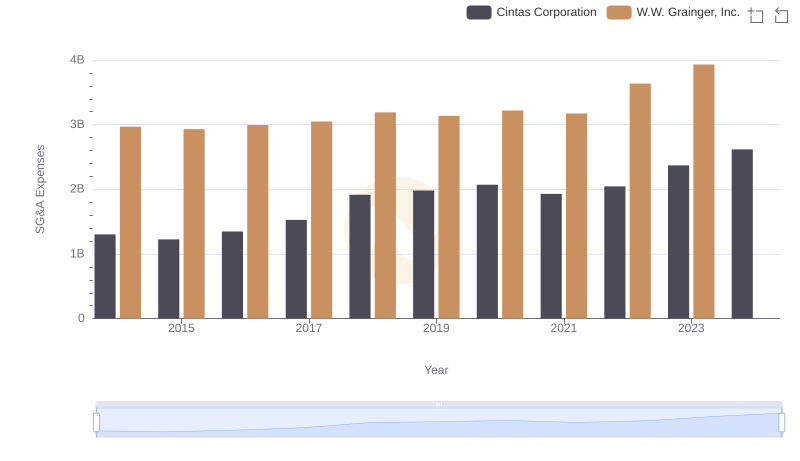
Cintas Corporation vs W.W. Grainger, Inc.: SG&A Expense Trends
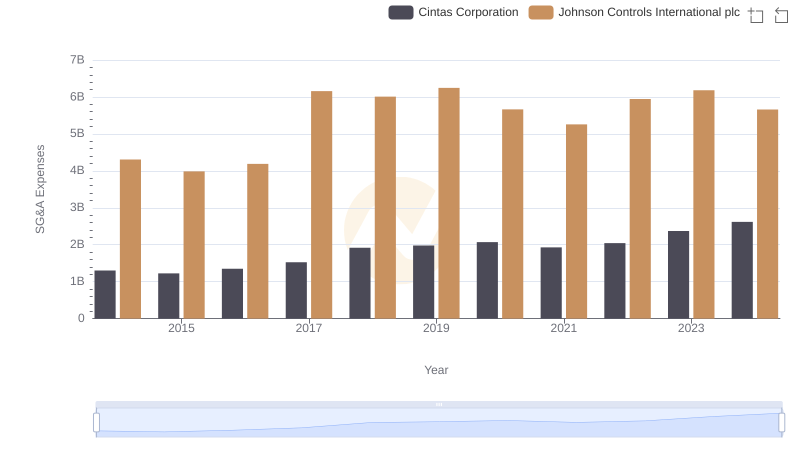
Cintas Corporation and Johnson Controls International plc: SG&A Spending Patterns Compared
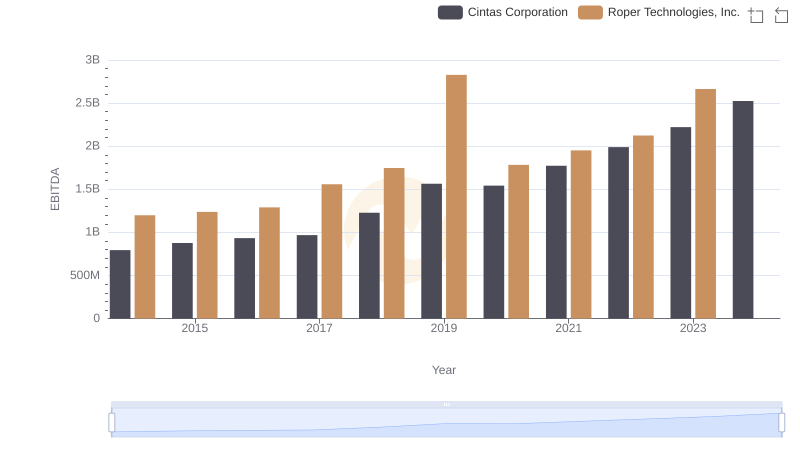
Comprehensive EBITDA Comparison: Cintas Corporation vs Roper Technologies, Inc.
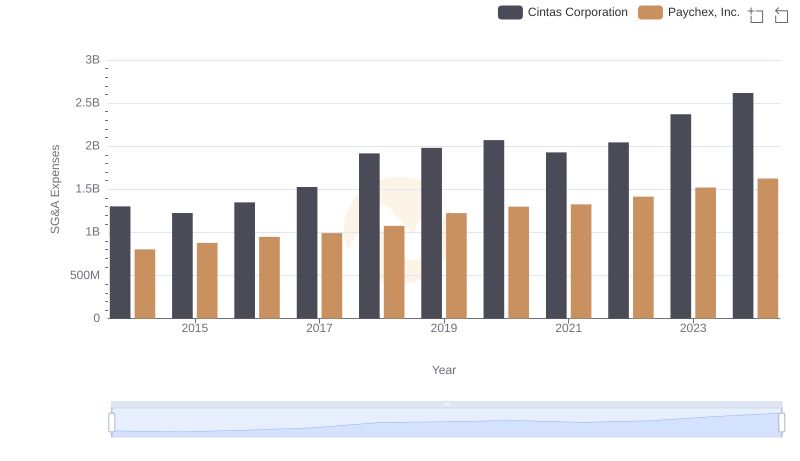
Comparing SG&A Expenses: Cintas Corporation vs Paychex, Inc. Trends and Insights
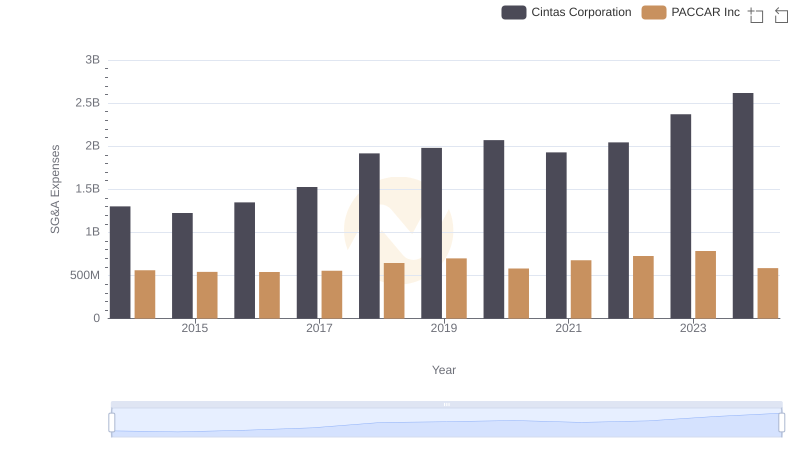
Cost Management Insights: SG&A Expenses for Cintas Corporation and PACCAR Inc