| __timestamp | Axon Enterprise, Inc. | Graco Inc. |
|---|---|---|
| Wednesday, January 1, 2014 | 54158000 | 303565000 |
| Thursday, January 1, 2015 | 69698000 | 324016000 |
| Friday, January 1, 2016 | 108076000 | 341734000 |
| Sunday, January 1, 2017 | 138692000 | 372496000 |
| Monday, January 1, 2018 | 156886000 | 382988000 |
| Tuesday, January 1, 2019 | 212959000 | 367743000 |
| Wednesday, January 1, 2020 | 307286000 | 355796000 |
| Friday, January 1, 2021 | 515007000 | 422975000 |
| Saturday, January 1, 2022 | 401575000 | 404731000 |
| Sunday, January 1, 2023 | 496874000 | 432156000 |
| Monday, January 1, 2024 | 465133000 |
Unleashing insights
In the ever-evolving landscape of corporate finance, understanding Selling, General, and Administrative (SG&A) expenses is crucial for effective cost management. This analysis delves into the SG&A expenses of Axon Enterprise, Inc. and Graco Inc. from 2014 to 2023.
Axon Enterprise, Inc. has seen a remarkable increase in SG&A expenses, growing by over 800% from 2014 to 2023. This surge reflects the company's aggressive expansion and investment in administrative capabilities. Notably, 2021 marked a peak with expenses reaching approximately 515 million, a significant leap from previous years.
Graco Inc., on the other hand, has maintained a more stable trajectory, with SG&A expenses increasing by about 42% over the same period. The company's consistent growth strategy is evident, with expenses peaking in 2024 at around 465 million.
This comparative analysis highlights the diverse strategies employed by these companies in managing their operational costs.
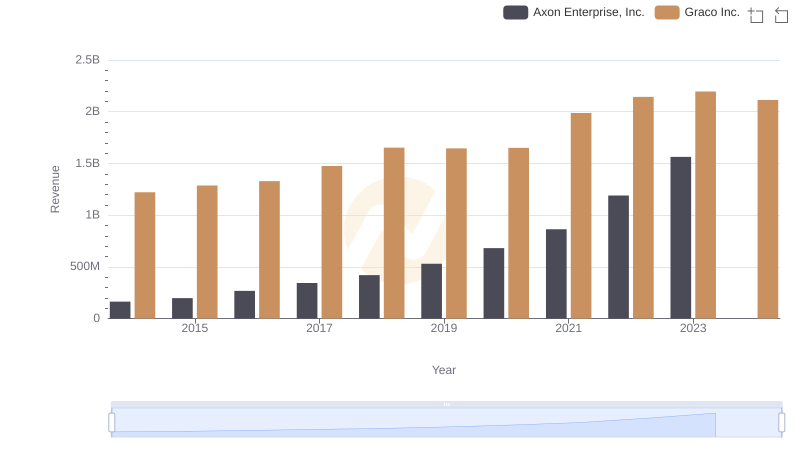
Axon Enterprise, Inc. vs Graco Inc.: Examining Key Revenue Metrics
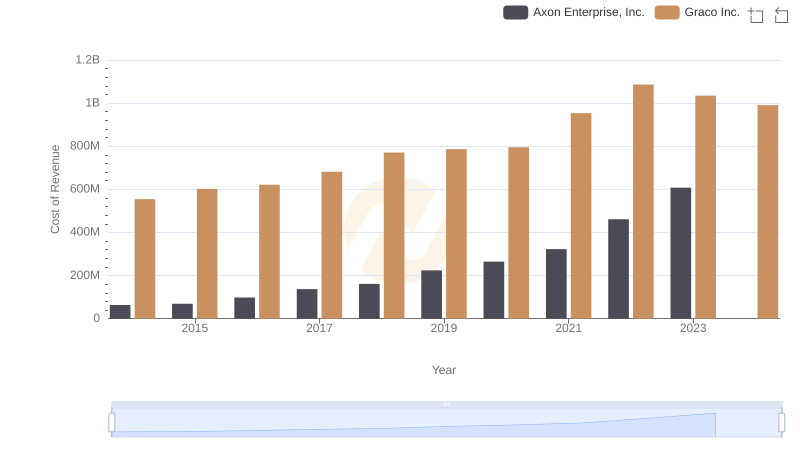
Axon Enterprise, Inc. vs Graco Inc.: Efficiency in Cost of Revenue Explored
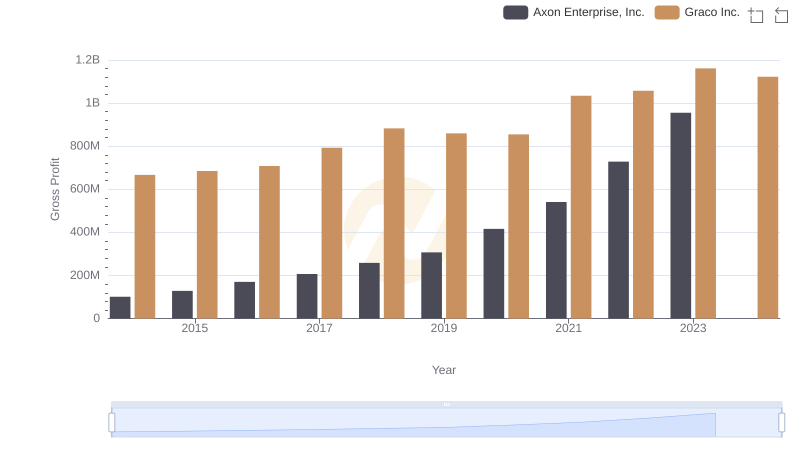
Axon Enterprise, Inc. vs Graco Inc.: A Gross Profit Performance Breakdown
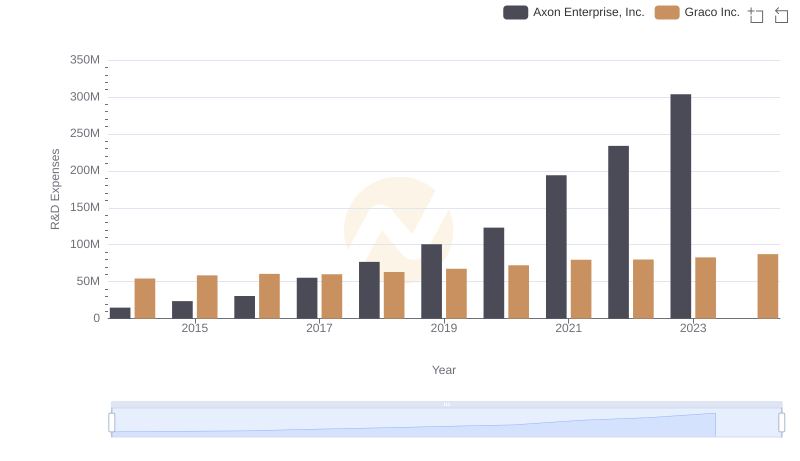
Analyzing R&D Budgets: Axon Enterprise, Inc. vs Graco Inc.
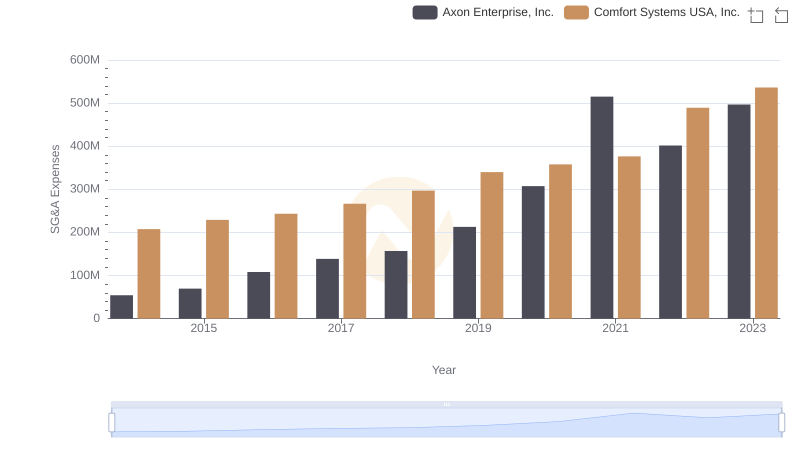
Axon Enterprise, Inc. or Comfort Systems USA, Inc.: Who Manages SG&A Costs Better?

Axon Enterprise, Inc. and Avery Dennison Corporation: SG&A Spending Patterns Compared
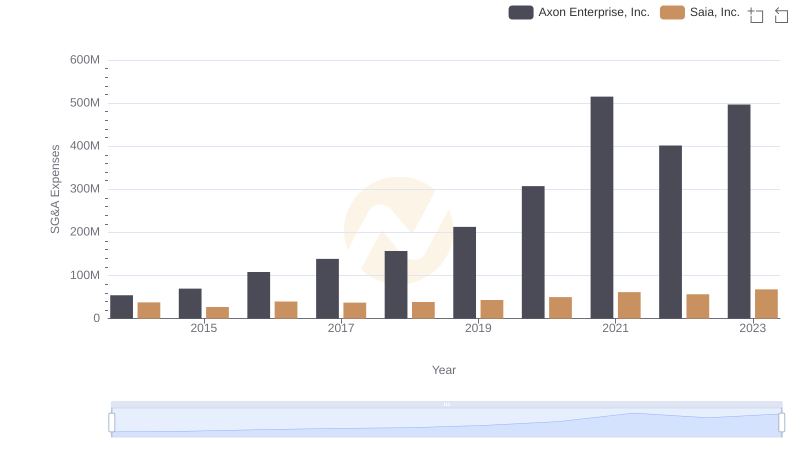
Axon Enterprise, Inc. and Saia, Inc.: SG&A Spending Patterns Compared
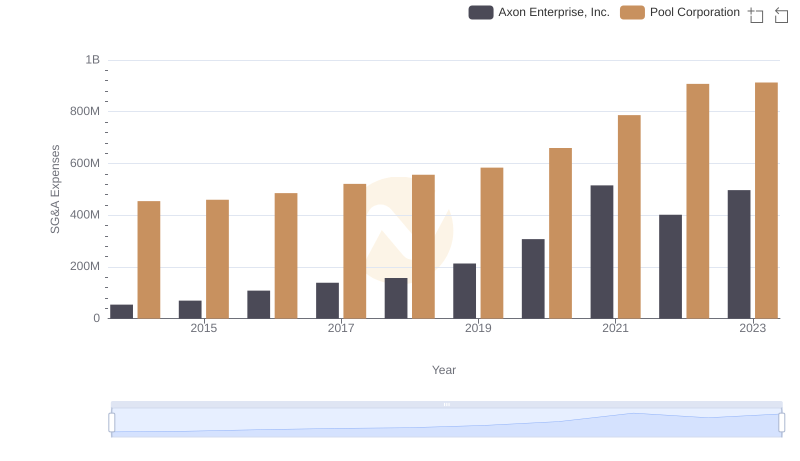
Comparing SG&A Expenses: Axon Enterprise, Inc. vs Pool Corporation Trends and Insights
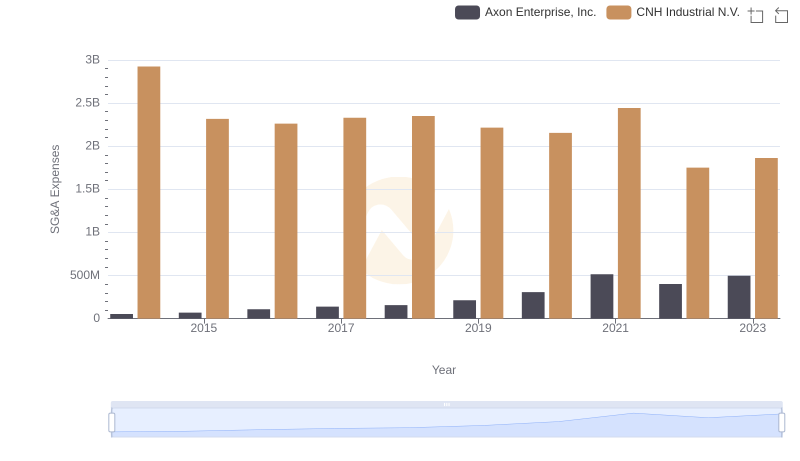
Operational Costs Compared: SG&A Analysis of Axon Enterprise, Inc. and CNH Industrial N.V.
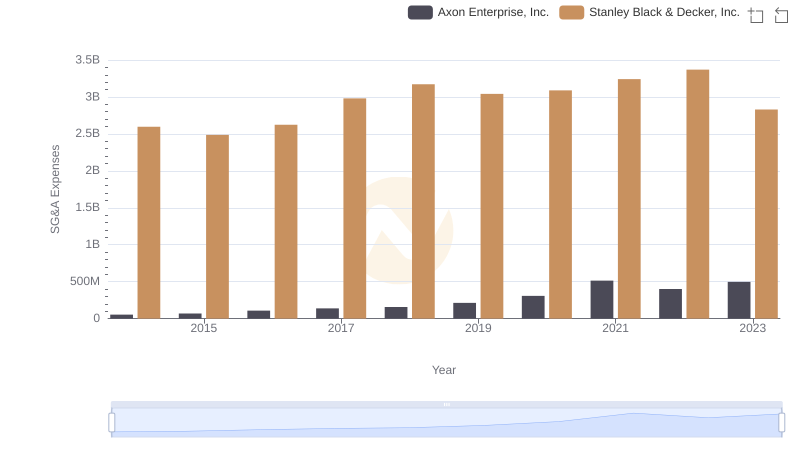
Axon Enterprise, Inc. vs Stanley Black & Decker, Inc.: SG&A Expense Trends
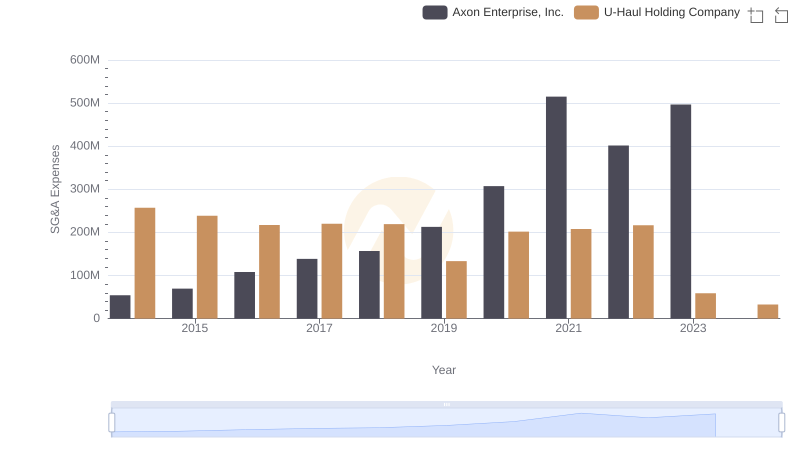
Cost Management Insights: SG&A Expenses for Axon Enterprise, Inc. and U-Haul Holding Company
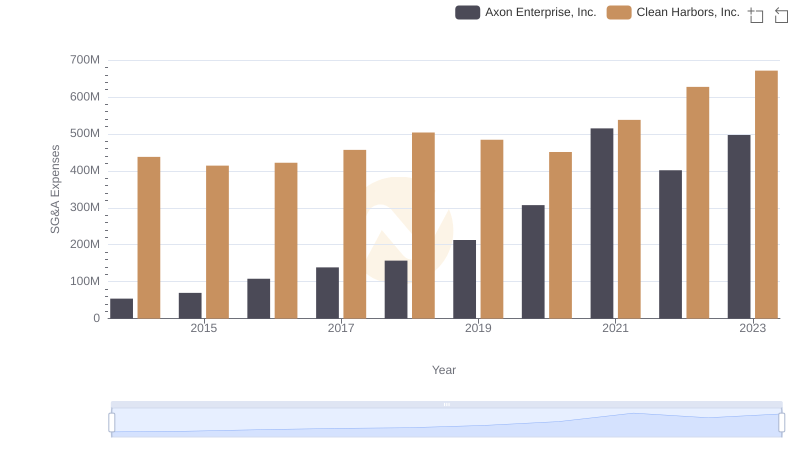
Comparing SG&A Expenses: Axon Enterprise, Inc. vs Clean Harbors, Inc. Trends and Insights