| __timestamp | Axon Enterprise, Inc. | Graco Inc. |
|---|---|---|
| Wednesday, January 1, 2014 | 101548000 | 666736000 |
| Thursday, January 1, 2015 | 128647000 | 684700000 |
| Friday, January 1, 2016 | 170536000 | 708239000 |
| Sunday, January 1, 2017 | 207088000 | 793049000 |
| Monday, January 1, 2018 | 258583000 | 882539000 |
| Tuesday, January 1, 2019 | 307286000 | 859756000 |
| Wednesday, January 1, 2020 | 416331000 | 854937000 |
| Friday, January 1, 2021 | 540910000 | 1033949000 |
| Saturday, January 1, 2022 | 728638000 | 1057439000 |
| Sunday, January 1, 2023 | 955382000 | 1161021000 |
| Monday, January 1, 2024 | 1122461000 |
Unleashing insights
In the competitive landscape of industrial and technology sectors, Axon Enterprise, Inc. and Graco Inc. have showcased remarkable growth trajectories over the past decade. From 2014 to 2023, Axon Enterprise's gross profit surged by an impressive 840%, reflecting its strategic innovations and market expansion. Meanwhile, Graco Inc. maintained a steady growth of 74%, underscoring its resilience and consistent market presence.
While Axon Enterprise's growth trajectory is steeper, Graco Inc.'s consistent performance highlights its stability. The data for 2024 is incomplete, leaving room for speculation on future trends.
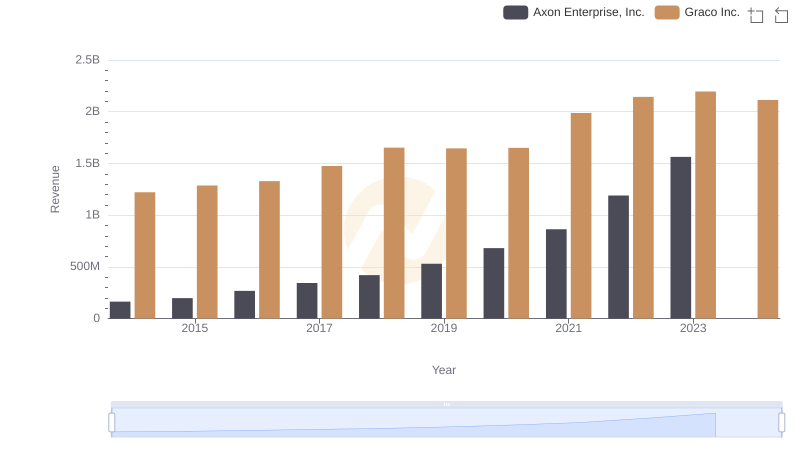
Axon Enterprise, Inc. vs Graco Inc.: Examining Key Revenue Metrics
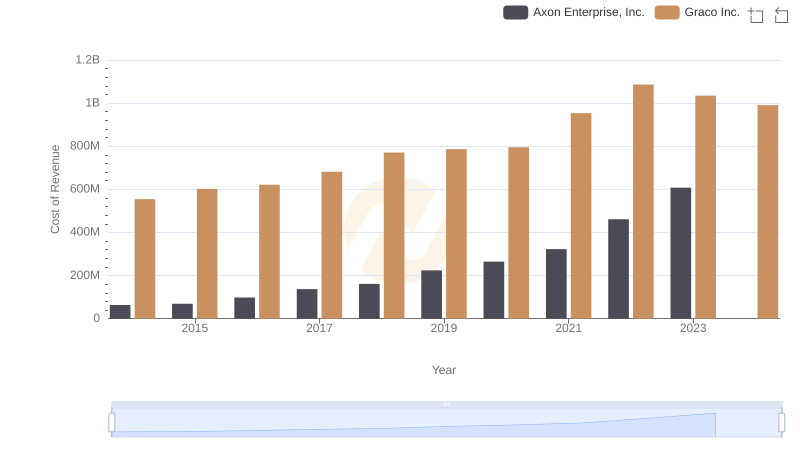
Axon Enterprise, Inc. vs Graco Inc.: Efficiency in Cost of Revenue Explored
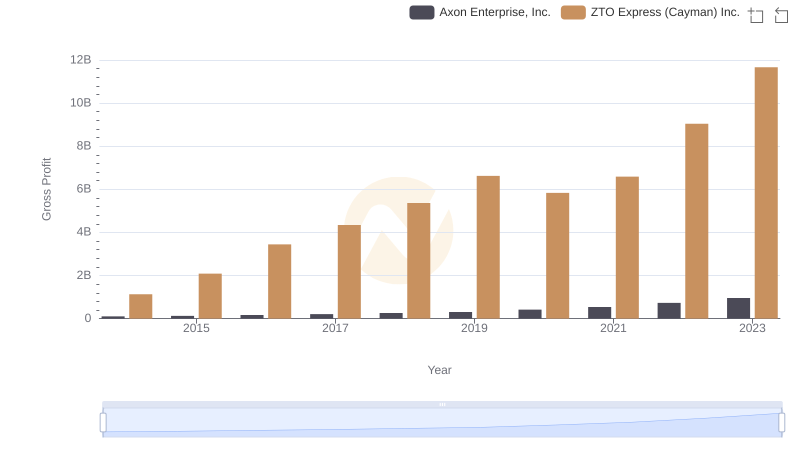
Axon Enterprise, Inc. and ZTO Express (Cayman) Inc.: A Detailed Gross Profit Analysis
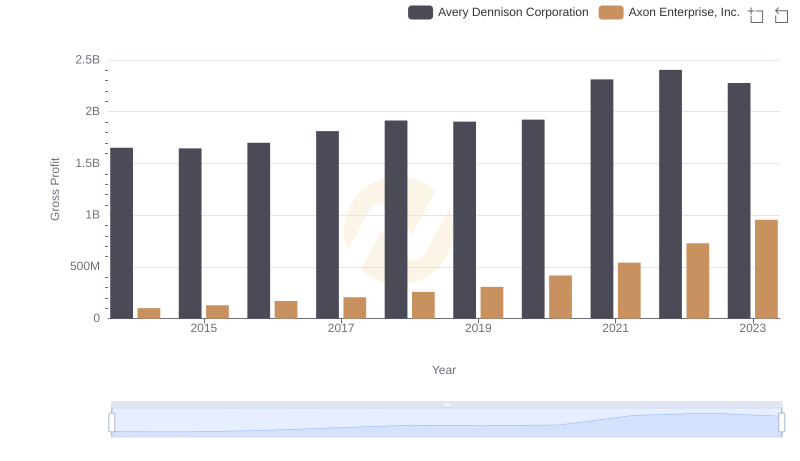
Who Generates Higher Gross Profit? Axon Enterprise, Inc. or Avery Dennison Corporation
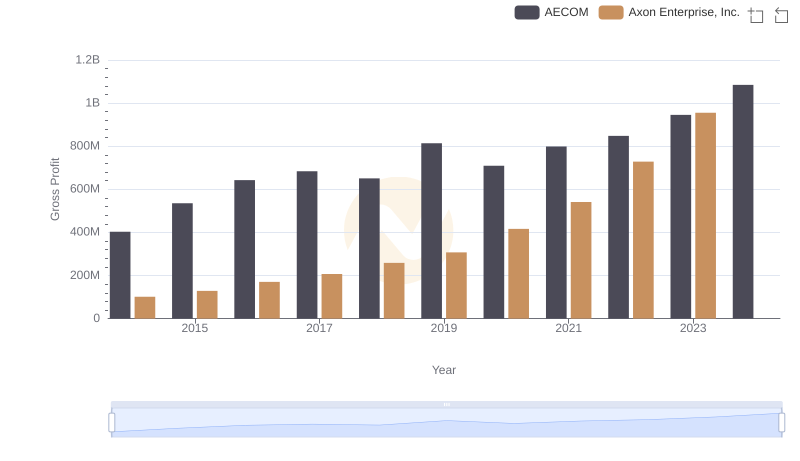
Gross Profit Comparison: Axon Enterprise, Inc. and AECOM Trends
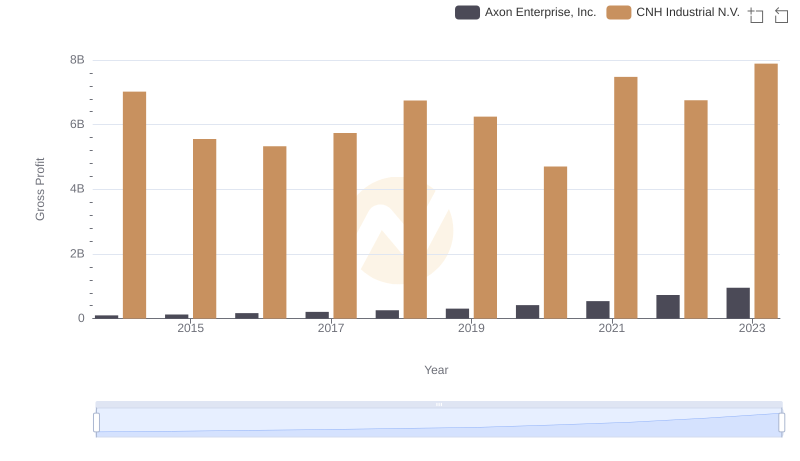
Who Generates Higher Gross Profit? Axon Enterprise, Inc. or CNH Industrial N.V.
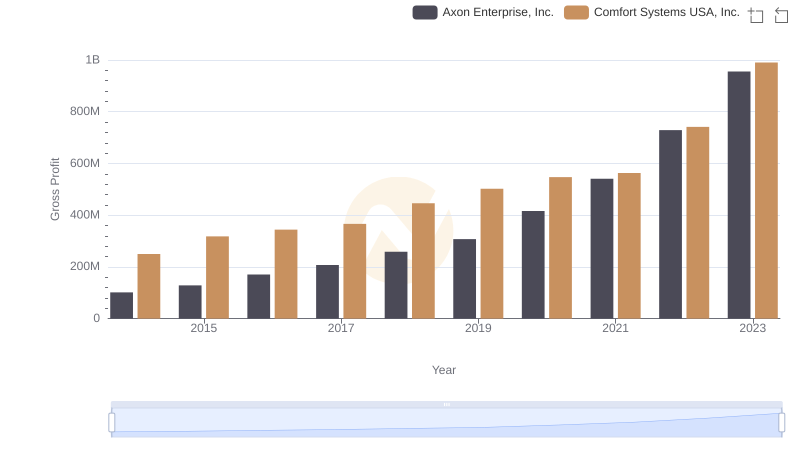
Gross Profit Comparison: Axon Enterprise, Inc. and Comfort Systems USA, Inc. Trends
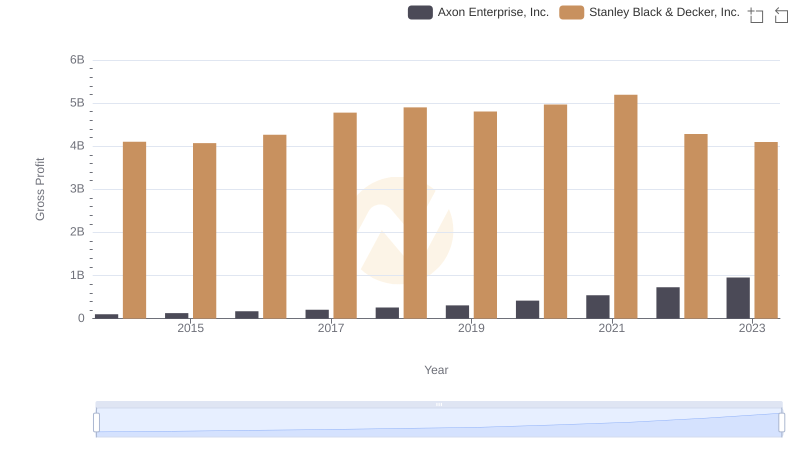
Who Generates Higher Gross Profit? Axon Enterprise, Inc. or Stanley Black & Decker, Inc.
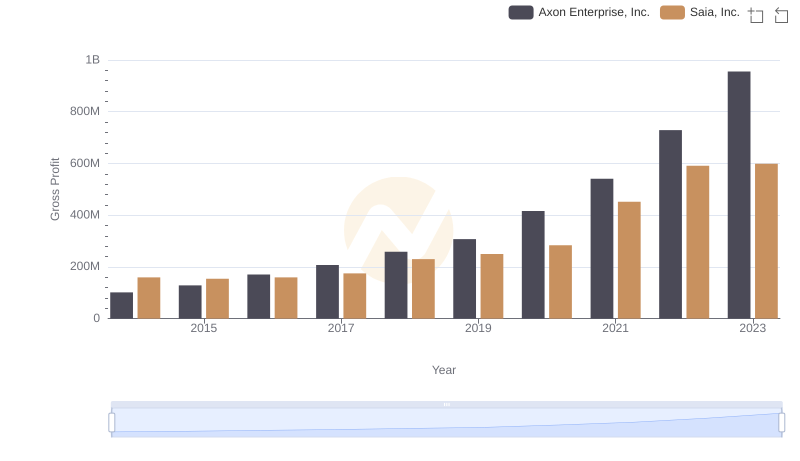
Gross Profit Comparison: Axon Enterprise, Inc. and Saia, Inc. Trends
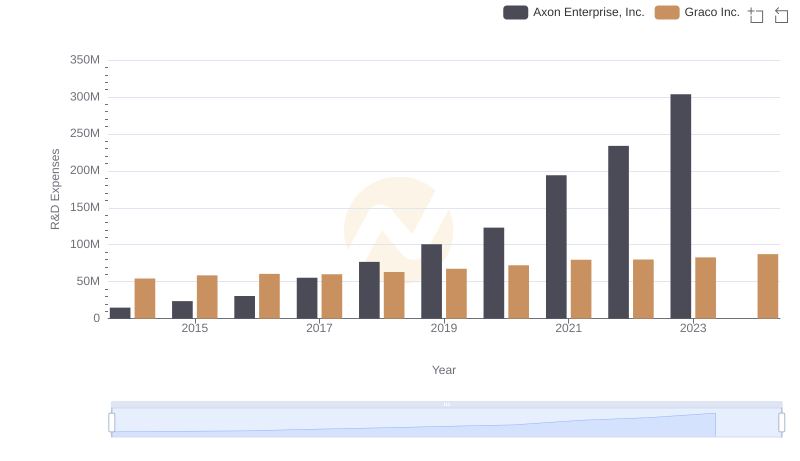
Analyzing R&D Budgets: Axon Enterprise, Inc. vs Graco Inc.
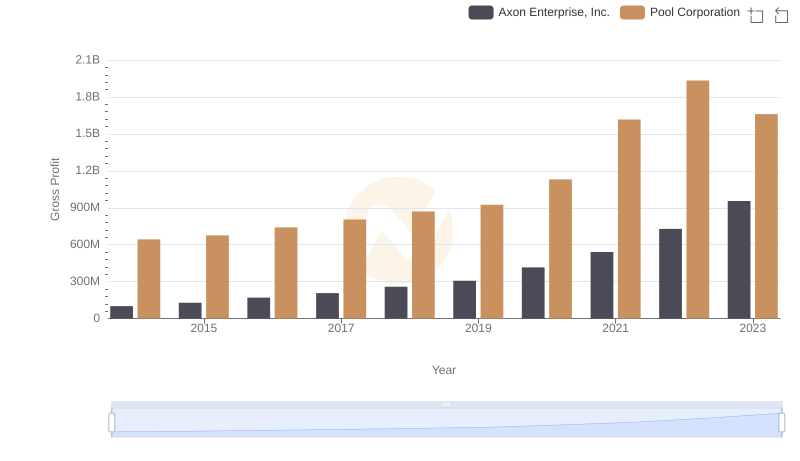
Gross Profit Analysis: Comparing Axon Enterprise, Inc. and Pool Corporation
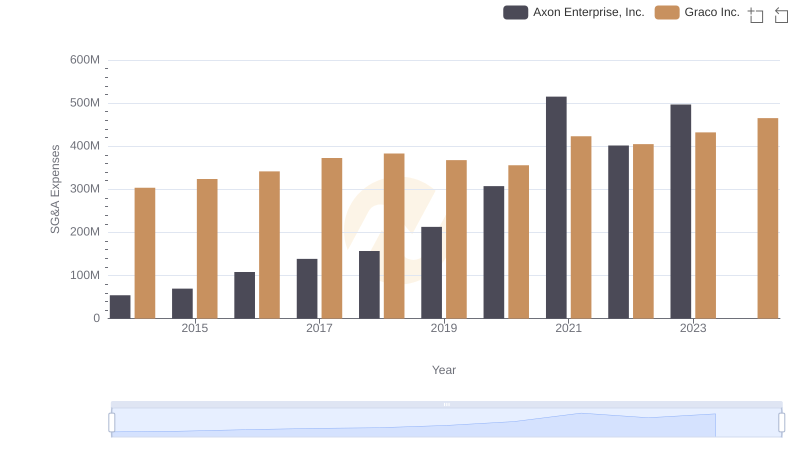
Cost Management Insights: SG&A Expenses for Axon Enterprise, Inc. and Graco Inc.