| __timestamp | Axon Enterprise, Inc. | Graco Inc. |
|---|---|---|
| Wednesday, January 1, 2014 | 62977000 | 554394000 |
| Thursday, January 1, 2015 | 69245000 | 601785000 |
| Friday, January 1, 2016 | 97709000 | 621054000 |
| Sunday, January 1, 2017 | 136710000 | 681695000 |
| Monday, January 1, 2018 | 161485000 | 770753000 |
| Tuesday, January 1, 2019 | 223574000 | 786289000 |
| Wednesday, January 1, 2020 | 264672000 | 795178000 |
| Friday, January 1, 2021 | 322471000 | 953659000 |
| Saturday, January 1, 2022 | 461297000 | 1086082000 |
| Sunday, January 1, 2023 | 608009000 | 1034585000 |
| Monday, January 1, 2024 | 990855000 |
Data in motion
In the competitive landscape of industrial manufacturing, cost efficiency is a critical metric. This analysis delves into the cost of revenue trends for Axon Enterprise, Inc. and Graco Inc. from 2014 to 2023. Over this period, Graco Inc. consistently outpaced Axon in cost of revenue, peaking at over 1 billion in 2022. Axon, however, demonstrated a remarkable growth trajectory, with its cost of revenue increasing nearly tenfold, from approximately 63 million in 2014 to 608 million in 2023. This growth reflects Axon's strategic investments and scaling operations. Notably, Graco's cost of revenue saw a steady increase, with a 30% rise from 2014 to 2023, indicating robust market demand and operational expansion. The data for 2024 is incomplete, suggesting a need for further analysis to understand future trends. This comparison highlights the dynamic nature of cost management in the industrial sector.
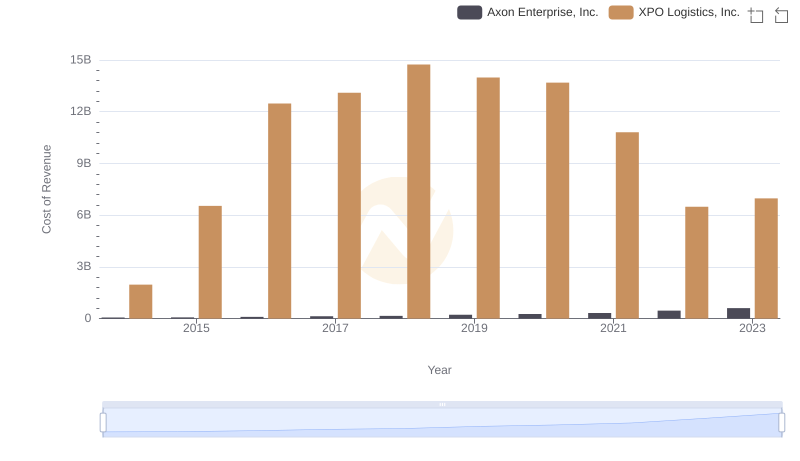
Comparing Cost of Revenue Efficiency: Axon Enterprise, Inc. vs XPO Logistics, Inc.
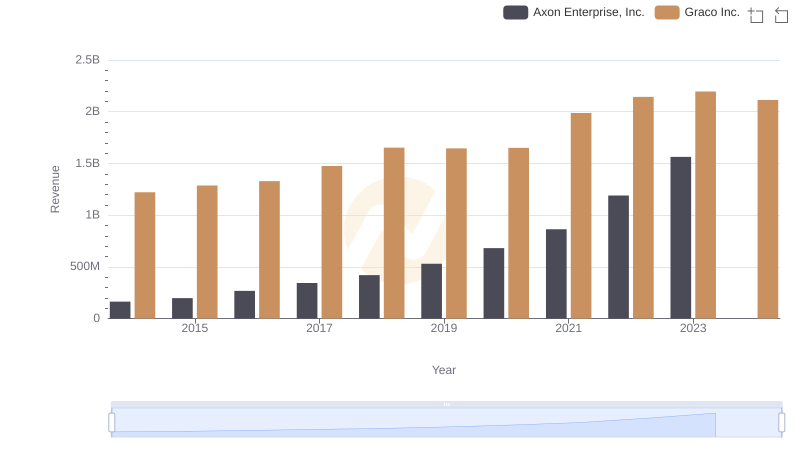
Axon Enterprise, Inc. vs Graco Inc.: Examining Key Revenue Metrics
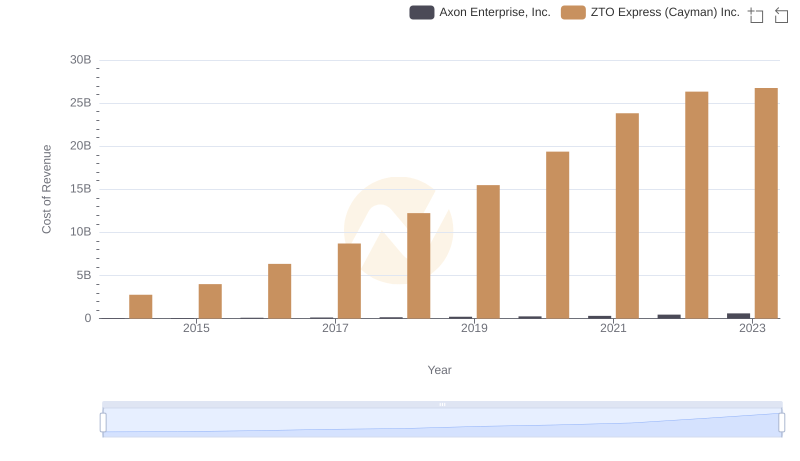
Analyzing Cost of Revenue: Axon Enterprise, Inc. and ZTO Express (Cayman) Inc.
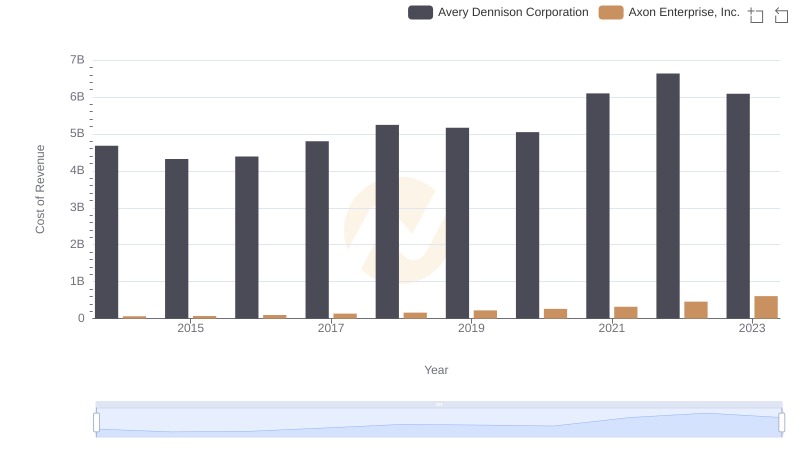
Comparing Cost of Revenue Efficiency: Axon Enterprise, Inc. vs Avery Dennison Corporation
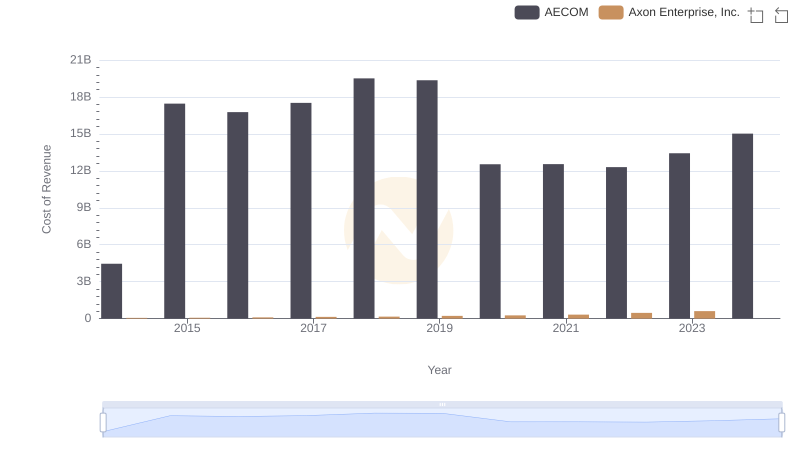
Comparing Cost of Revenue Efficiency: Axon Enterprise, Inc. vs AECOM
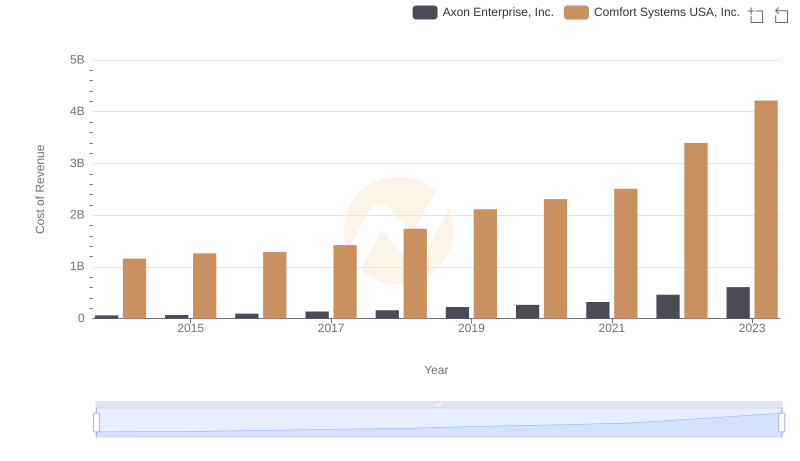
Analyzing Cost of Revenue: Axon Enterprise, Inc. and Comfort Systems USA, Inc.
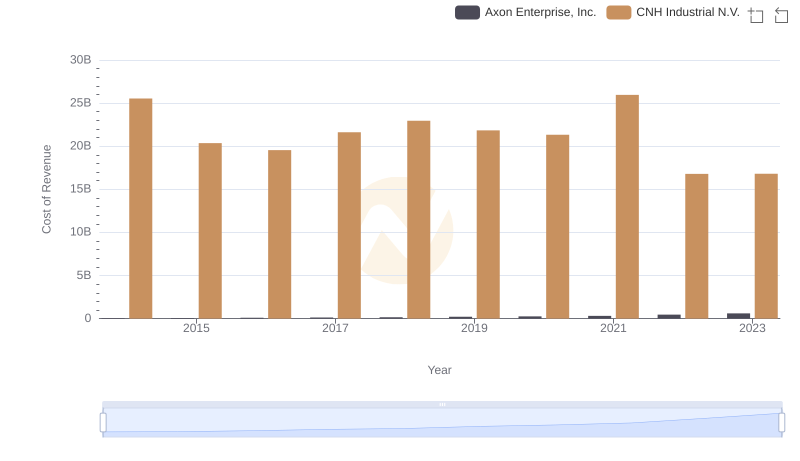
Cost Insights: Breaking Down Axon Enterprise, Inc. and CNH Industrial N.V.'s Expenses
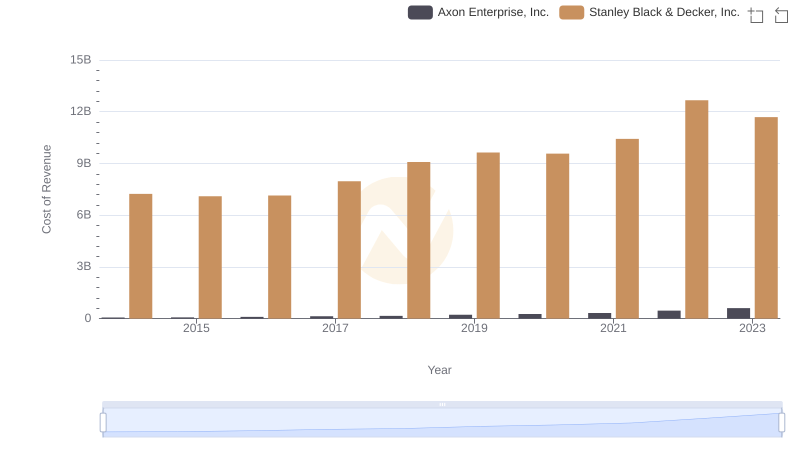
Cost Insights: Breaking Down Axon Enterprise, Inc. and Stanley Black & Decker, Inc.'s Expenses
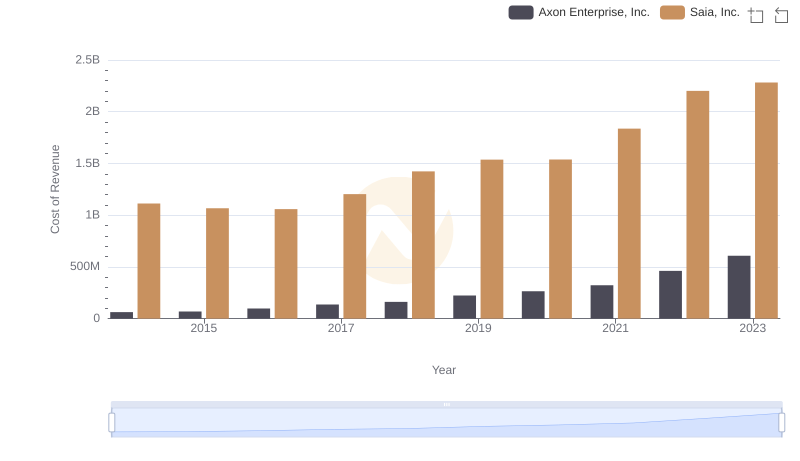
Cost of Revenue Trends: Axon Enterprise, Inc. vs Saia, Inc.
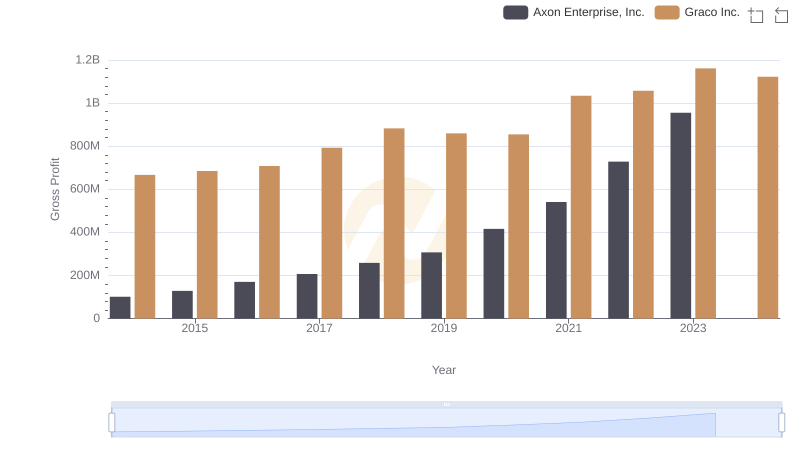
Axon Enterprise, Inc. vs Graco Inc.: A Gross Profit Performance Breakdown
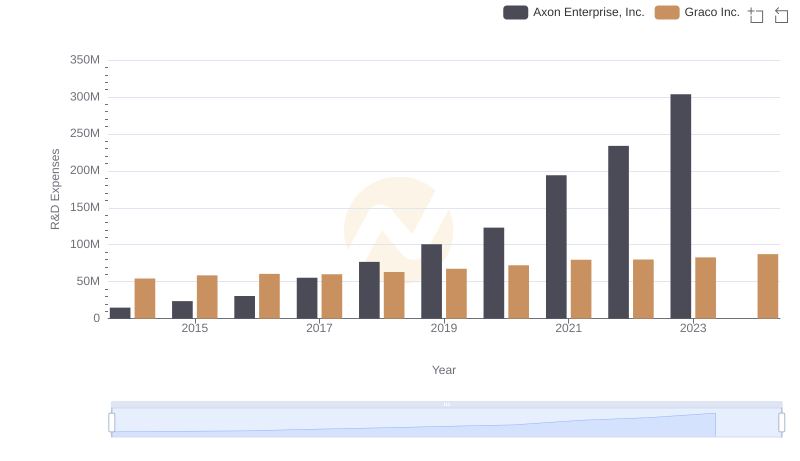
Analyzing R&D Budgets: Axon Enterprise, Inc. vs Graco Inc.
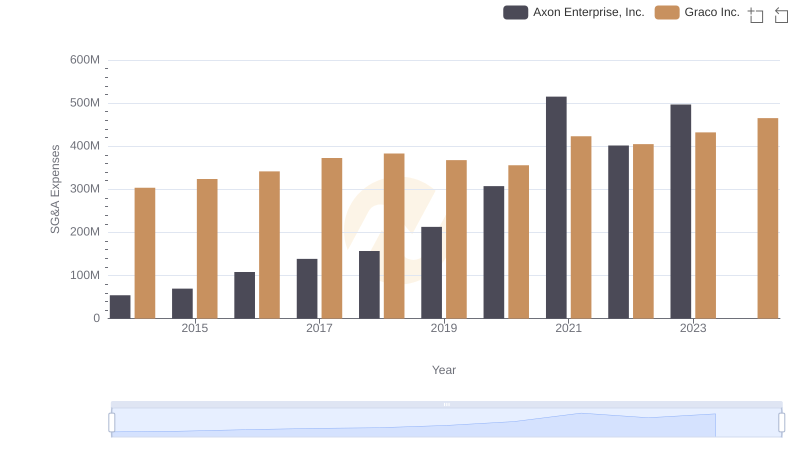
Cost Management Insights: SG&A Expenses for Axon Enterprise, Inc. and Graco Inc.