| __timestamp | Avery Dennison Corporation | Axon Enterprise, Inc. |
|---|---|---|
| Wednesday, January 1, 2014 | 1155300000 | 54158000 |
| Thursday, January 1, 2015 | 1108100000 | 69698000 |
| Friday, January 1, 2016 | 1097500000 | 108076000 |
| Sunday, January 1, 2017 | 1123200000 | 138692000 |
| Monday, January 1, 2018 | 1127500000 | 156886000 |
| Tuesday, January 1, 2019 | 1080400000 | 212959000 |
| Wednesday, January 1, 2020 | 1060500000 | 307286000 |
| Friday, January 1, 2021 | 1248500000 | 515007000 |
| Saturday, January 1, 2022 | 1330800000 | 401575000 |
| Sunday, January 1, 2023 | 1177900000 | 496874000 |
| Monday, January 1, 2024 | 1415300000 |
In pursuit of knowledge
In the ever-evolving landscape of corporate finance, understanding the spending patterns of industry leaders is crucial. Over the past decade, Axon Enterprise, Inc. and Avery Dennison Corporation have showcased distinct trajectories in their Selling, General, and Administrative (SG&A) expenses.
From 2014 to 2023, Avery Dennison's SG&A expenses have seen a modest increase of approximately 2% annually, peaking in 2022. In contrast, Axon Enterprise has experienced a dramatic rise, with expenses growing nearly tenfold, reflecting its aggressive expansion and innovation strategies.
While Avery Dennison maintains steady growth, Axon's rapid increase in SG&A spending highlights its commitment to scaling operations and capturing market share. This divergence in financial strategy underscores the dynamic nature of corporate growth and the varied paths companies take to achieve success.
These insights into SG&A spending patterns offer a window into the strategic priorities of these two industry giants, providing valuable lessons for investors and business leaders alike.
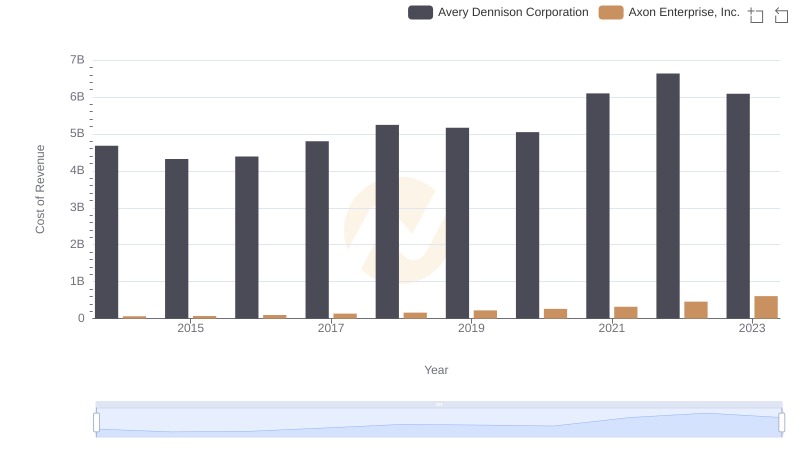
Comparing Cost of Revenue Efficiency: Axon Enterprise, Inc. vs Avery Dennison Corporation
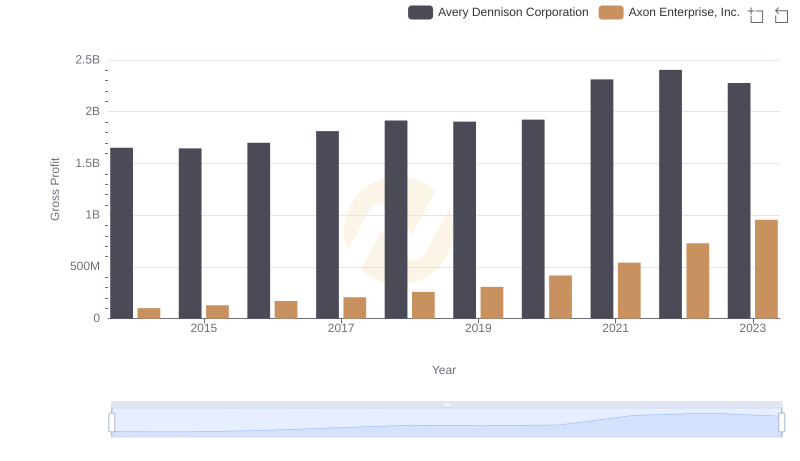
Who Generates Higher Gross Profit? Axon Enterprise, Inc. or Avery Dennison Corporation
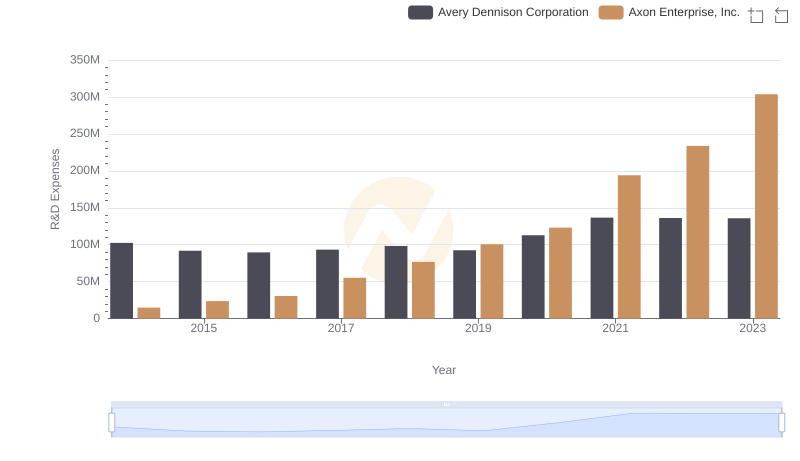
Who Prioritizes Innovation? R&D Spending Compared for Axon Enterprise, Inc. and Avery Dennison Corporation
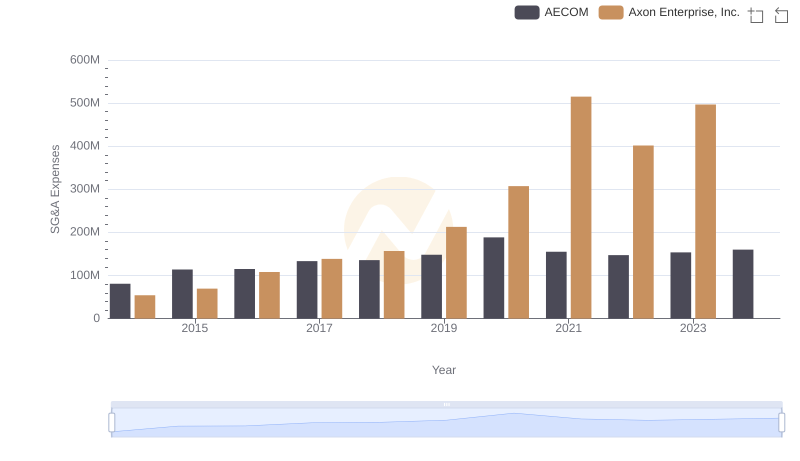
Who Optimizes SG&A Costs Better? Axon Enterprise, Inc. or AECOM
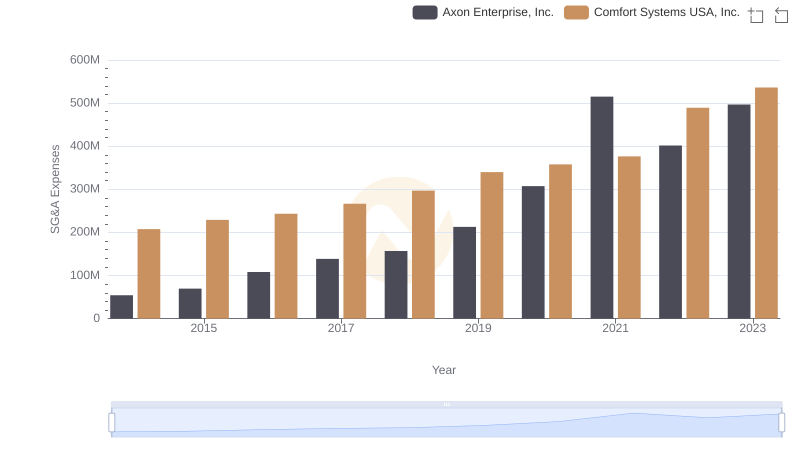
Axon Enterprise, Inc. or Comfort Systems USA, Inc.: Who Manages SG&A Costs Better?
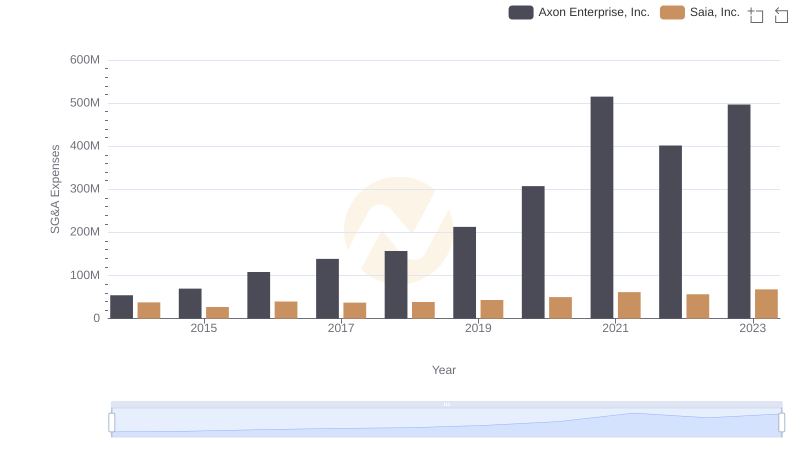
Axon Enterprise, Inc. and Saia, Inc.: SG&A Spending Patterns Compared
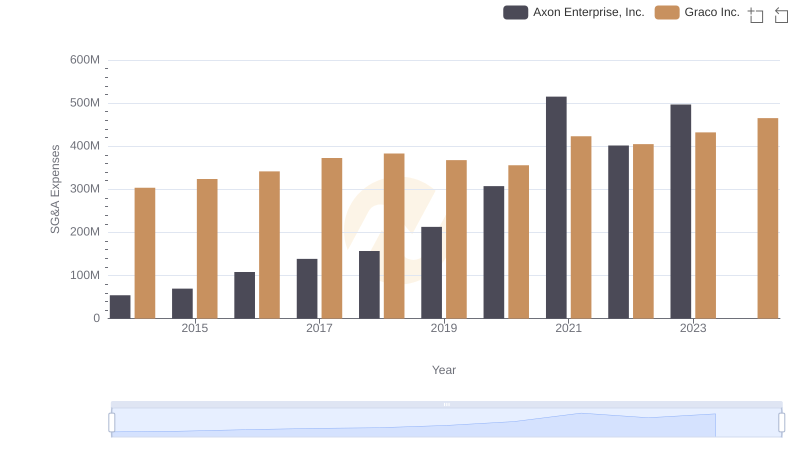
Cost Management Insights: SG&A Expenses for Axon Enterprise, Inc. and Graco Inc.
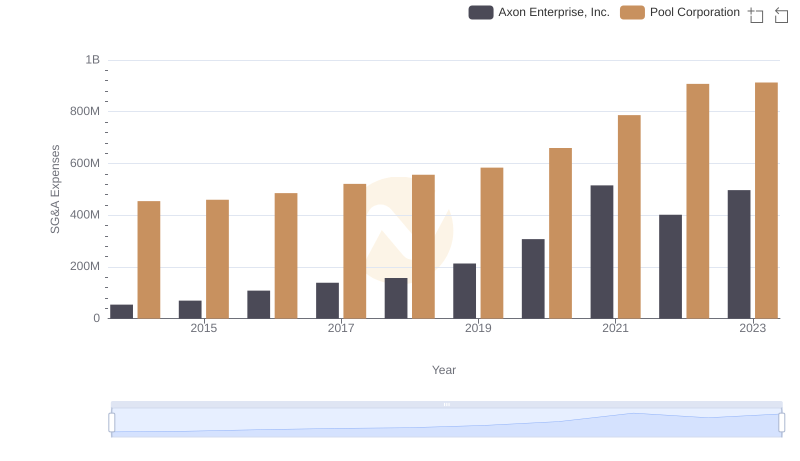
Comparing SG&A Expenses: Axon Enterprise, Inc. vs Pool Corporation Trends and Insights
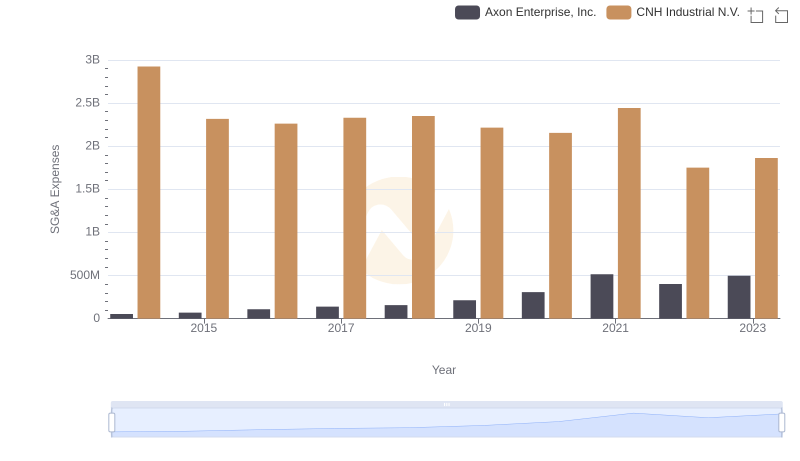
Operational Costs Compared: SG&A Analysis of Axon Enterprise, Inc. and CNH Industrial N.V.
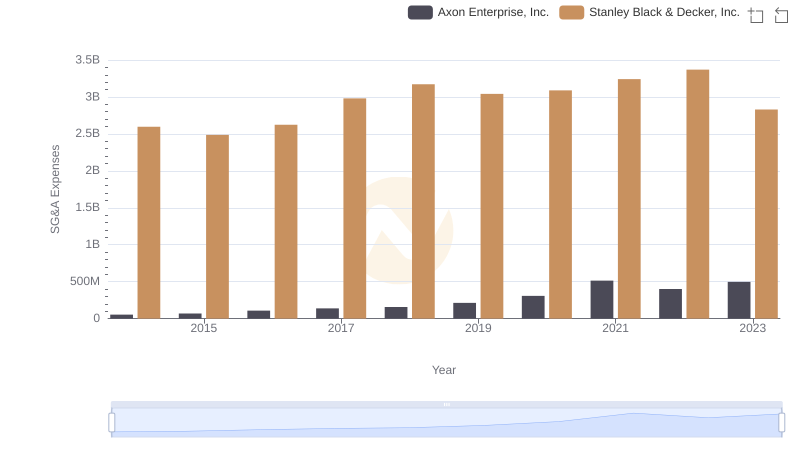
Axon Enterprise, Inc. vs Stanley Black & Decker, Inc.: SG&A Expense Trends
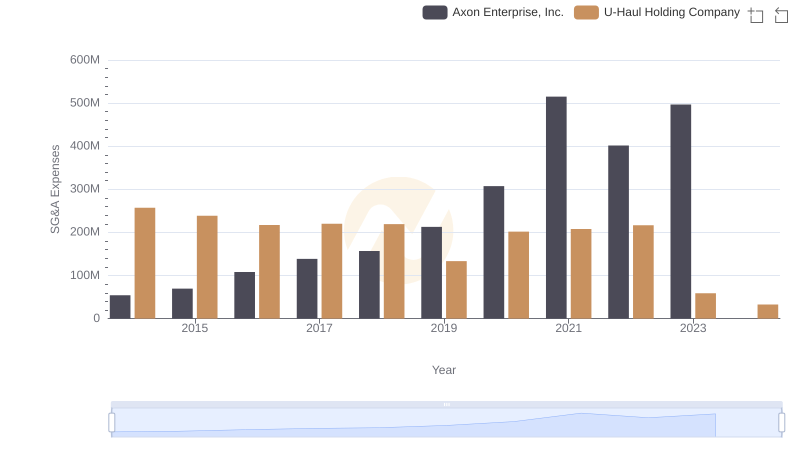
Cost Management Insights: SG&A Expenses for Axon Enterprise, Inc. and U-Haul Holding Company