| __timestamp | Axon Enterprise, Inc. | Stanley Black & Decker, Inc. |
|---|---|---|
| Wednesday, January 1, 2014 | 54158000 | 2595900000 |
| Thursday, January 1, 2015 | 69698000 | 2486400000 |
| Friday, January 1, 2016 | 108076000 | 2623900000 |
| Sunday, January 1, 2017 | 138692000 | 2980100000 |
| Monday, January 1, 2018 | 156886000 | 3171700000 |
| Tuesday, January 1, 2019 | 212959000 | 3041000000 |
| Wednesday, January 1, 2020 | 307286000 | 3089600000 |
| Friday, January 1, 2021 | 515007000 | 3240400000 |
| Saturday, January 1, 2022 | 401575000 | 3370000000 |
| Sunday, January 1, 2023 | 496874000 | 2829300000 |
| Monday, January 1, 2024 | 3310500000 |
In pursuit of knowledge
In the ever-evolving landscape of corporate finance, understanding the trends in Selling, General, and Administrative (SG&A) expenses is crucial for investors and analysts alike. Over the past decade, Axon Enterprise, Inc. and Stanley Black & Decker, Inc. have showcased contrasting trajectories in their SG&A expenditures.
From 2014 to 2023, Axon Enterprise, Inc. experienced a remarkable increase in SG&A expenses, growing by approximately 817%, reflecting its aggressive expansion and investment in operational capabilities. In contrast, Stanley Black & Decker, Inc. maintained a relatively stable SG&A expense profile, with fluctuations around the $3 billion mark, indicative of its mature market position and efficient cost management strategies.
This comparative analysis highlights the dynamic nature of business strategies and their financial implications, offering valuable insights for stakeholders aiming to navigate the complexities of corporate growth and sustainability.
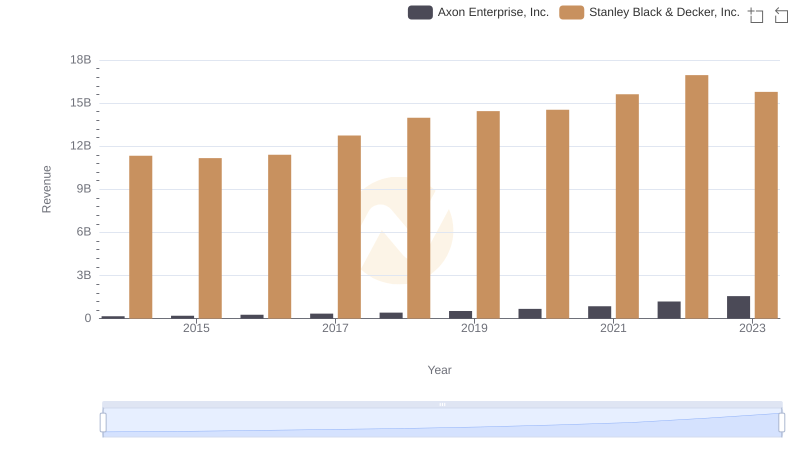
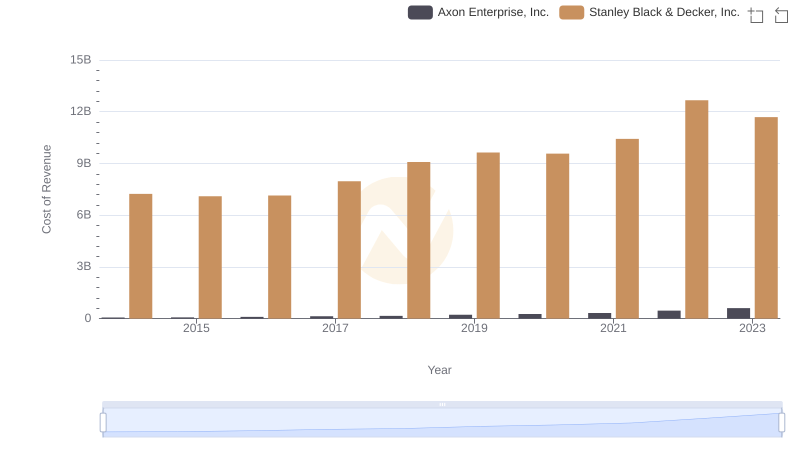
Revenue Showdown: Axon Enterprise, Inc. vs Stanley Black & Decker, Inc.

Cost of Revenue Trends: Axon Enterprise, Inc. vs Stanley Black & Decker, Inc.
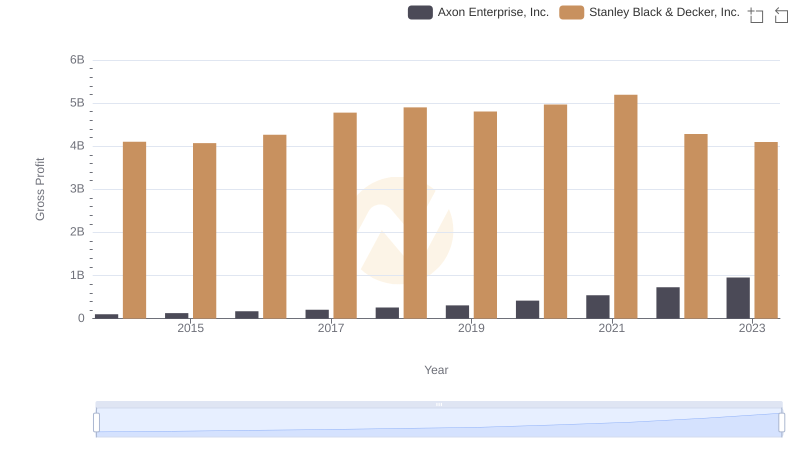
Axon Enterprise, Inc. and Stanley Black & Decker, Inc.: A Detailed Gross Profit Analysis
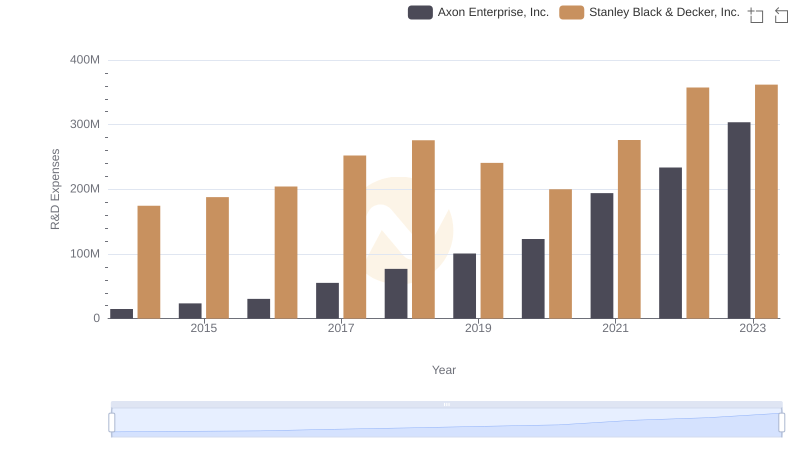
Who Prioritizes Innovation? R&D Spending Compared for Axon Enterprise, Inc. and Stanley Black & Decker, Inc.
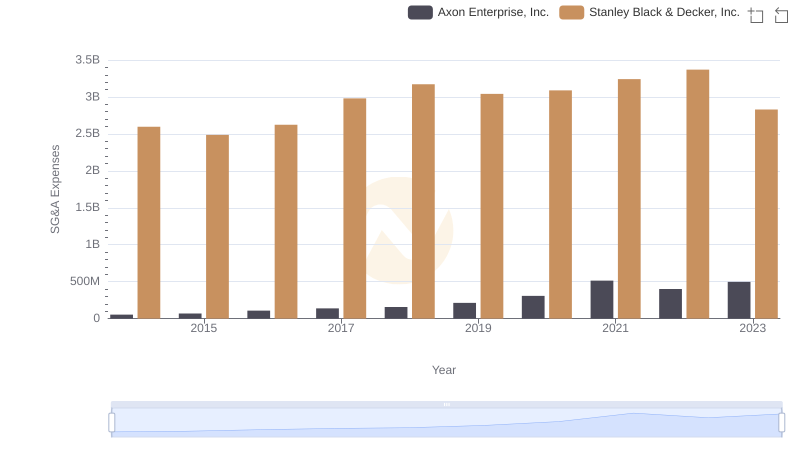
SG&A Efficiency Analysis: Comparing Axon Enterprise, Inc. and Stanley Black & Decker, Inc.
Cost Insights: Breaking Down Axon Enterprise, Inc. and Stanley Black & Decker, Inc.'s Expenses

Who Generates Higher Gross Profit? Axon Enterprise, Inc. or Stanley Black & Decker, Inc.

Research and Development Expenses Breakdown: Axon Enterprise, Inc. vs Stanley Black & Decker, Inc.
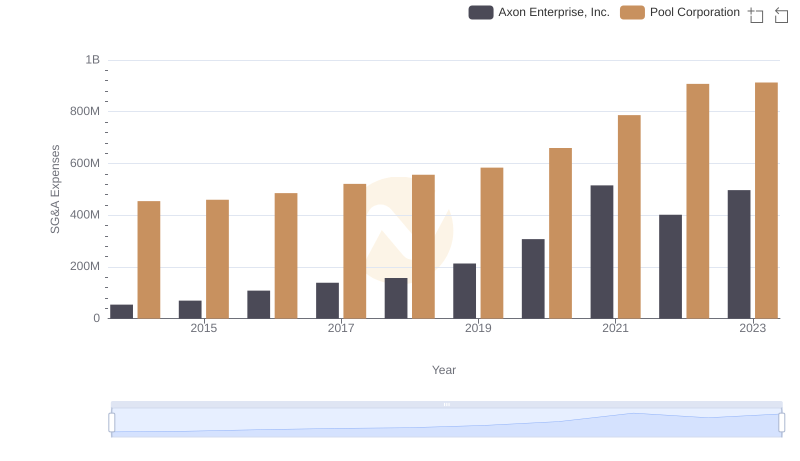
Comparing SG&A Expenses: Axon Enterprise, Inc. vs Pool Corporation Trends and Insights
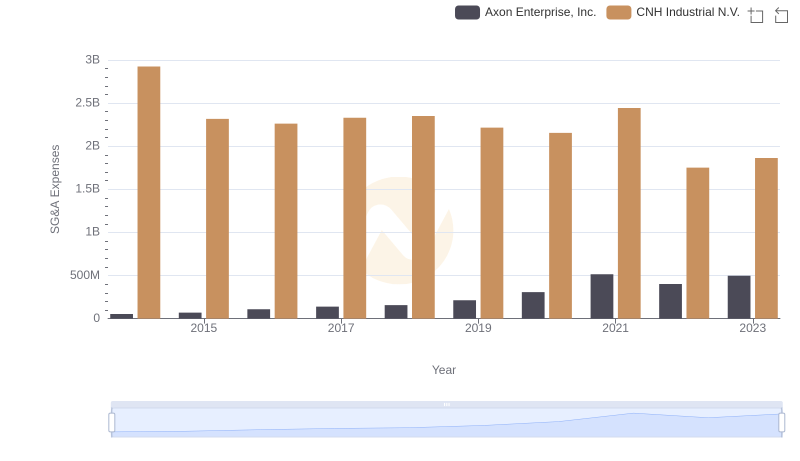
Operational Costs Compared: SG&A Analysis of Axon Enterprise, Inc. and CNH Industrial N.V.
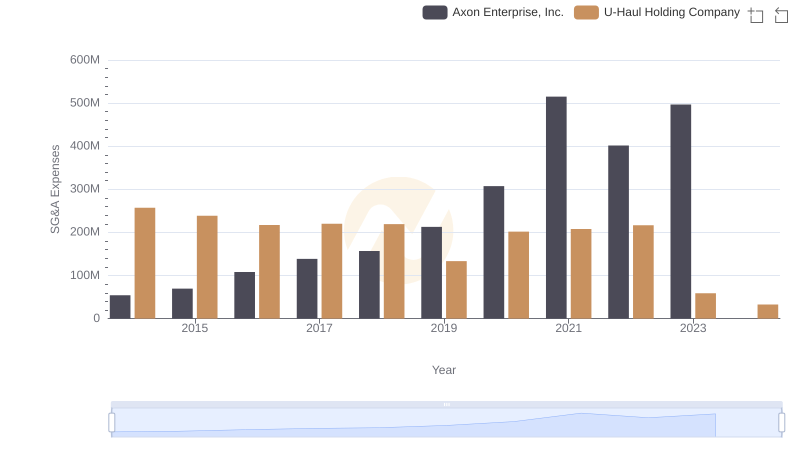
Cost Management Insights: SG&A Expenses for Axon Enterprise, Inc. and U-Haul Holding Company