| __timestamp | Axon Enterprise, Inc. | Graco Inc. |
|---|---|---|
| Wednesday, January 1, 2014 | 164525000 | 1221130000 |
| Thursday, January 1, 2015 | 197892000 | 1286485000 |
| Friday, January 1, 2016 | 268245000 | 1329293000 |
| Sunday, January 1, 2017 | 343798000 | 1474744000 |
| Monday, January 1, 2018 | 420068000 | 1653292000 |
| Tuesday, January 1, 2019 | 530860000 | 1646045000 |
| Wednesday, January 1, 2020 | 681003000 | 1650115000 |
| Friday, January 1, 2021 | 863381000 | 1987608000 |
| Saturday, January 1, 2022 | 1189935000 | 2143521000 |
| Sunday, January 1, 2023 | 1563391000 | 2195606000 |
| Monday, January 1, 2024 | 2113316000 |
Data in motion
In the ever-evolving landscape of American industry, Axon Enterprise, Inc. and Graco Inc. stand as exemplars of growth and resilience. Over the past decade, Axon has seen its revenue skyrocket by nearly 850%, from approximately $165 million in 2014 to an impressive $1.56 billion in 2023. This remarkable growth underscores Axon's strategic innovations in public safety technology.
Meanwhile, Graco Inc., a stalwart in fluid handling systems, has demonstrated steady revenue growth of around 80% over the same period, reaching $2.2 billion in 2023. This consistent performance highlights Graco's robust market presence and adaptability.
While Axon's meteoric rise is noteworthy, Graco's stability offers a compelling narrative of enduring success. As we look to the future, the absence of Axon's 2024 data leaves us eagerly anticipating their next chapter in this dynamic industrial saga.
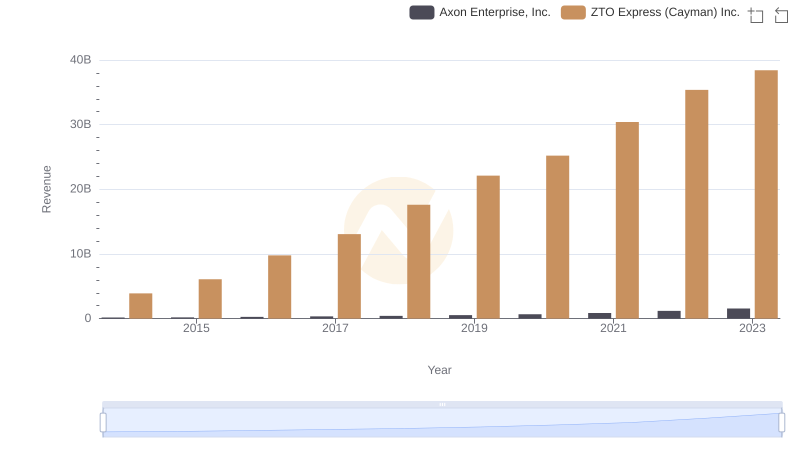
Breaking Down Revenue Trends: Axon Enterprise, Inc. vs ZTO Express (Cayman) Inc.

Axon Enterprise, Inc. or Textron Inc.: Who Leads in Yearly Revenue?
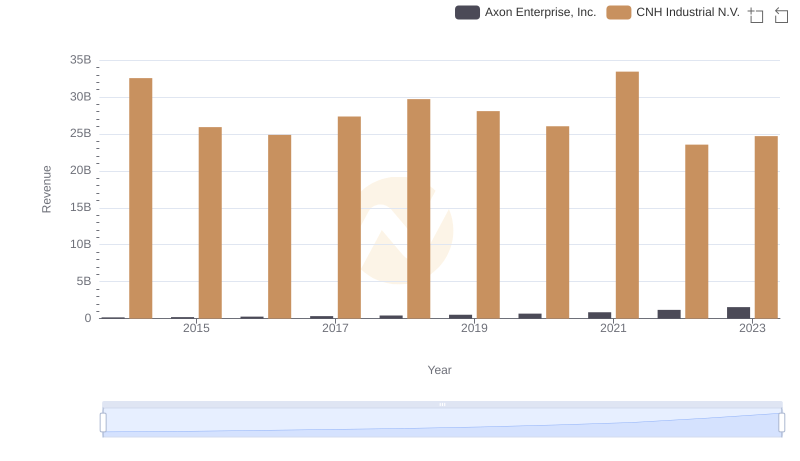
Axon Enterprise, Inc. vs CNH Industrial N.V.: Examining Key Revenue Metrics
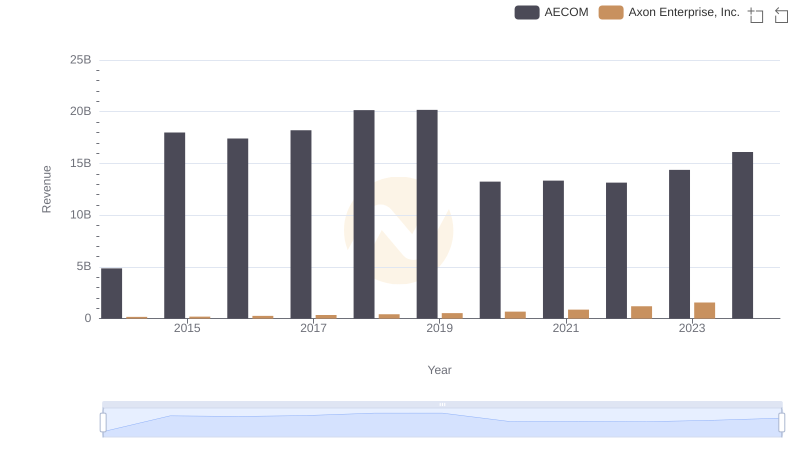
Who Generates More Revenue? Axon Enterprise, Inc. or AECOM
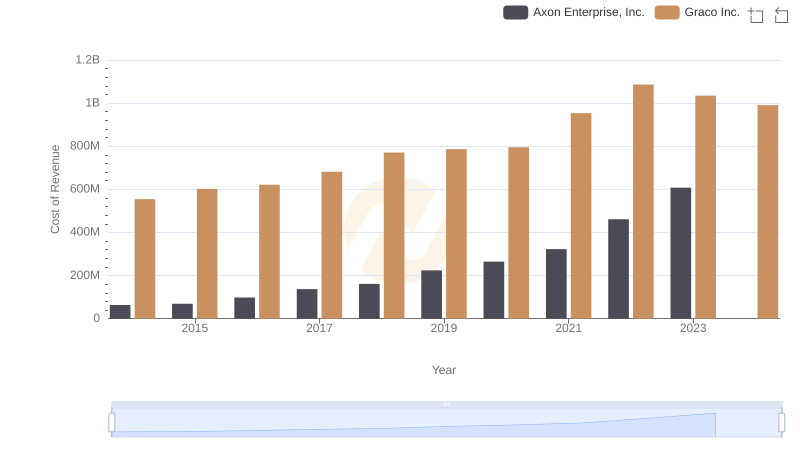
Axon Enterprise, Inc. vs Graco Inc.: Efficiency in Cost of Revenue Explored
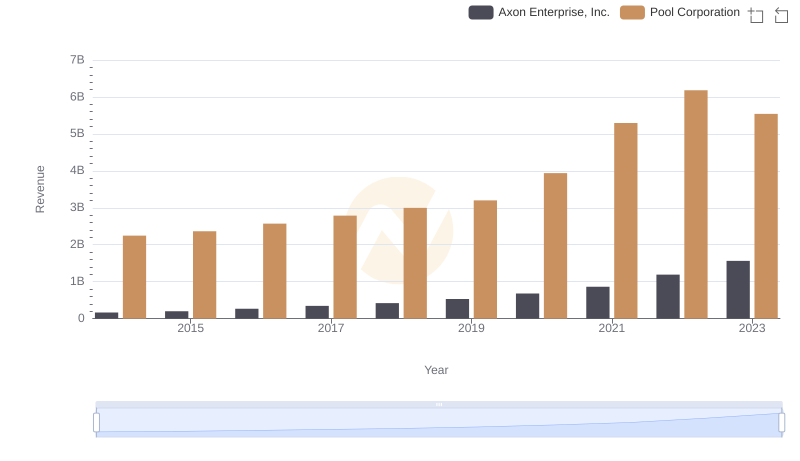
Axon Enterprise, Inc. vs Pool Corporation: Annual Revenue Growth Compared
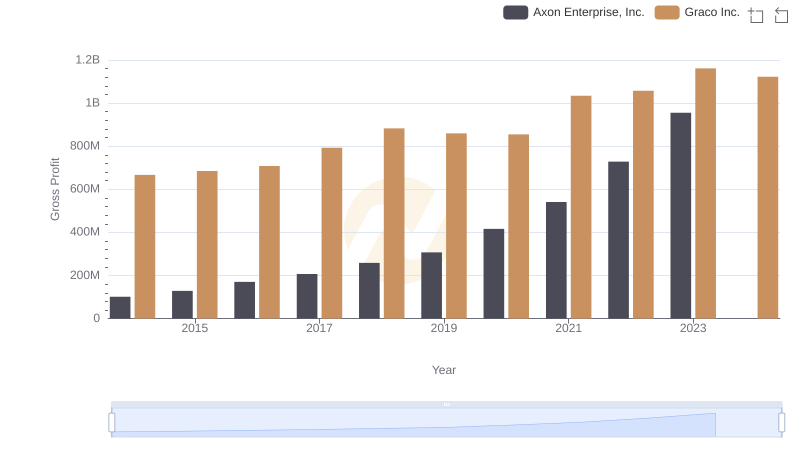
Axon Enterprise, Inc. vs Graco Inc.: A Gross Profit Performance Breakdown
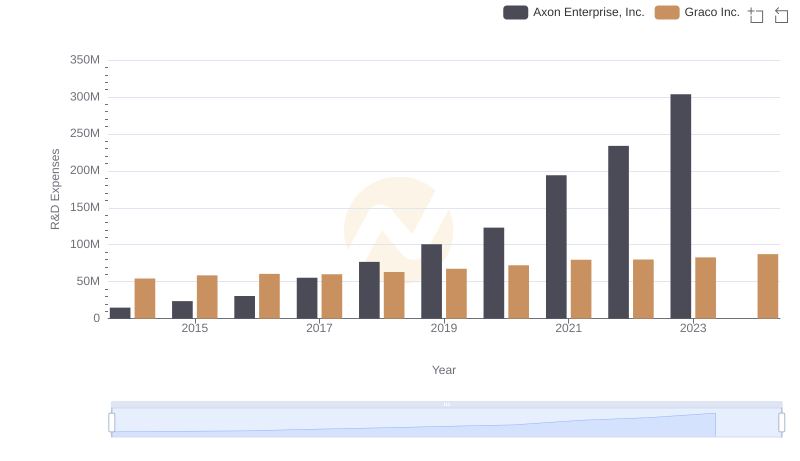
Analyzing R&D Budgets: Axon Enterprise, Inc. vs Graco Inc.
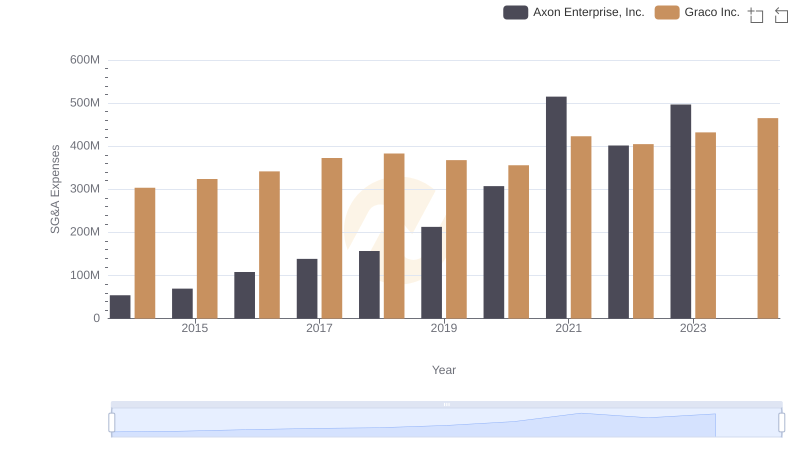
Cost Management Insights: SG&A Expenses for Axon Enterprise, Inc. and Graco Inc.