| __timestamp | Axon Enterprise, Inc. | Saia, Inc. |
|---|---|---|
| Wednesday, January 1, 2014 | 54158000 | 37563000 |
| Thursday, January 1, 2015 | 69698000 | 26832000 |
| Friday, January 1, 2016 | 108076000 | 39625000 |
| Sunday, January 1, 2017 | 138692000 | 37162000 |
| Monday, January 1, 2018 | 156886000 | 38425000 |
| Tuesday, January 1, 2019 | 212959000 | 43073000 |
| Wednesday, January 1, 2020 | 307286000 | 49761000 |
| Friday, January 1, 2021 | 515007000 | 61345000 |
| Saturday, January 1, 2022 | 401575000 | 56601000 |
| Sunday, January 1, 2023 | 496874000 | 67984000 |
In pursuit of knowledge
In the dynamic world of corporate finance, understanding the spending patterns of industry leaders can offer valuable insights. Over the past decade, Axon Enterprise, Inc. and Saia, Inc. have demonstrated distinct trajectories in their Selling, General, and Administrative (SG&A) expenses. From 2014 to 2023, Axon Enterprise, Inc. saw a staggering increase of over 800% in SG&A expenses, peaking in 2021. This reflects their aggressive growth strategy and investment in operational expansion. In contrast, Saia, Inc. maintained a more conservative approach, with a steady increase of approximately 80% over the same period. This divergence highlights the different strategic priorities of these companies, with Axon focusing on rapid expansion and Saia on sustainable growth. As we move forward, these patterns may offer clues about future market positioning and competitive dynamics.
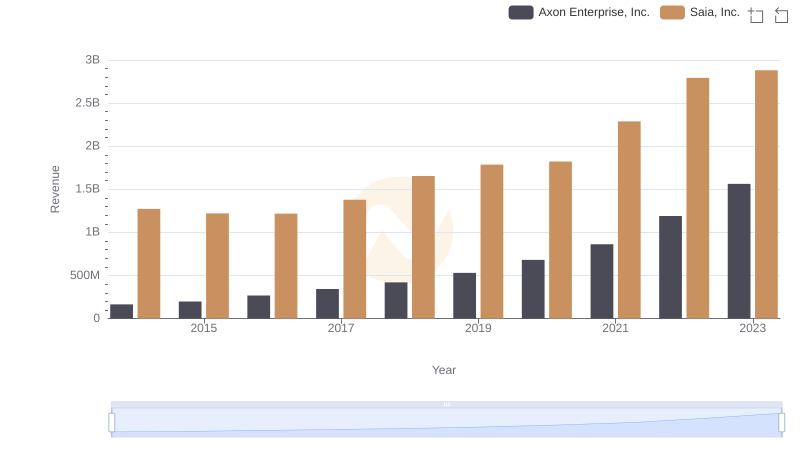
Axon Enterprise, Inc. or Saia, Inc.: Who Leads in Yearly Revenue?
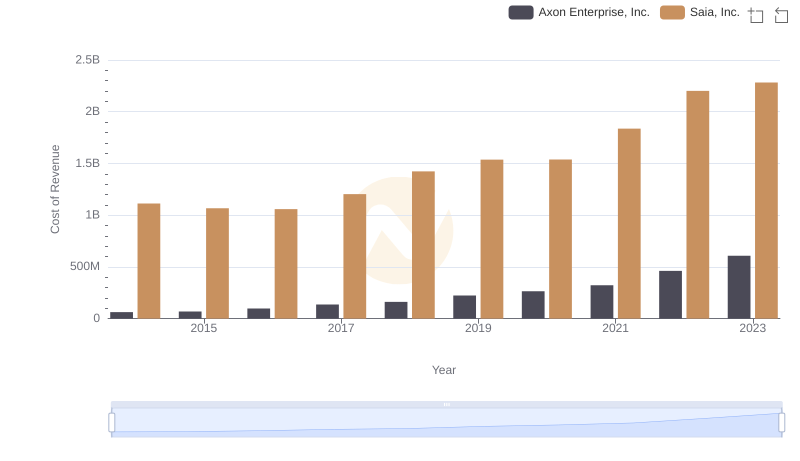
Cost of Revenue Trends: Axon Enterprise, Inc. vs Saia, Inc.
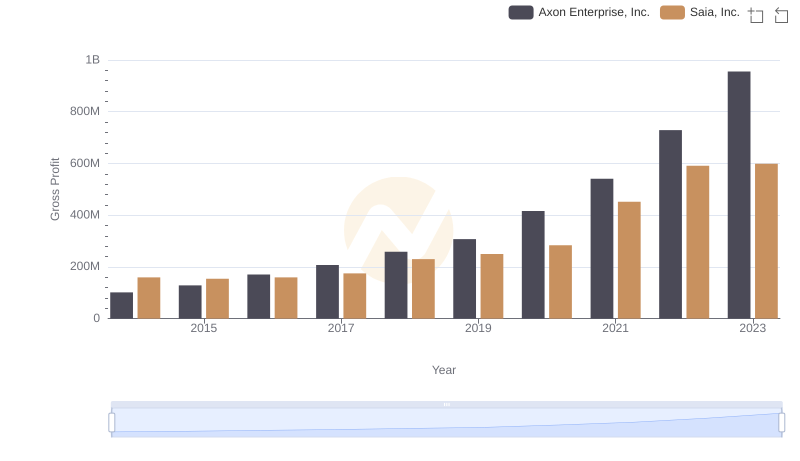
Gross Profit Comparison: Axon Enterprise, Inc. and Saia, Inc. Trends
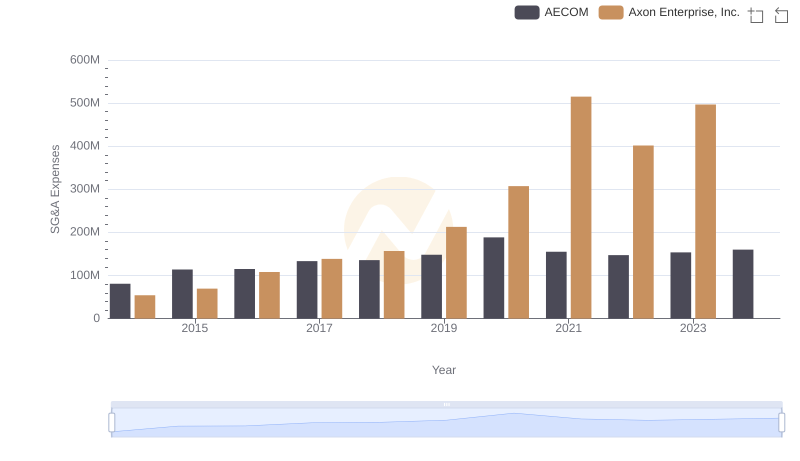
Who Optimizes SG&A Costs Better? Axon Enterprise, Inc. or AECOM
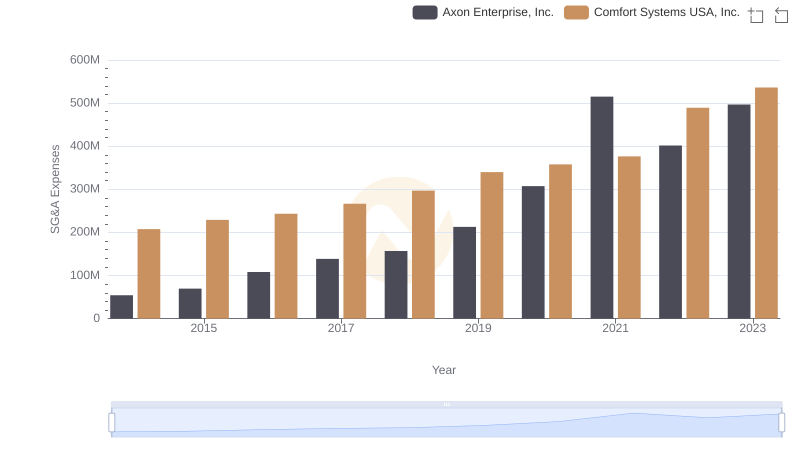
Axon Enterprise, Inc. or Comfort Systems USA, Inc.: Who Manages SG&A Costs Better?

Axon Enterprise, Inc. and Avery Dennison Corporation: SG&A Spending Patterns Compared
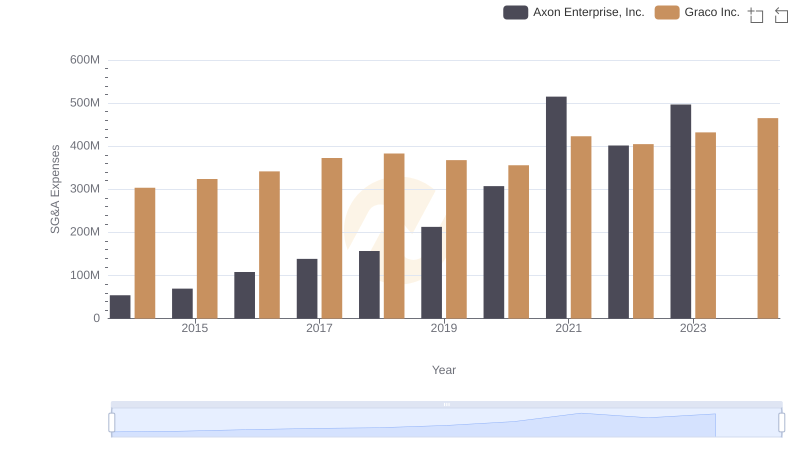
Cost Management Insights: SG&A Expenses for Axon Enterprise, Inc. and Graco Inc.
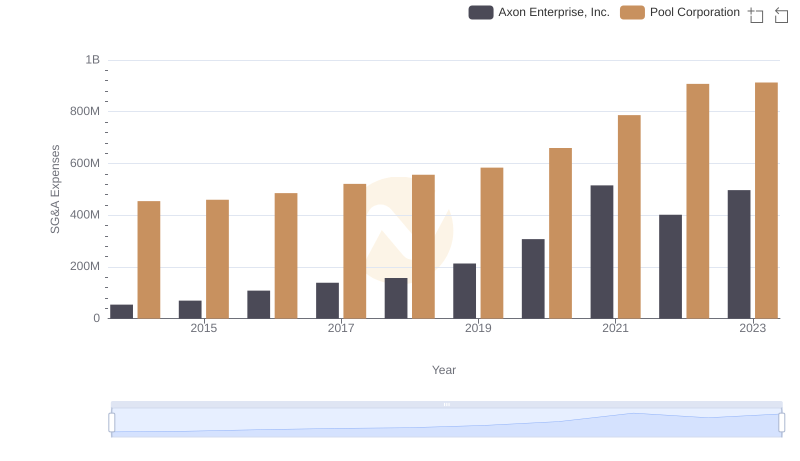
Comparing SG&A Expenses: Axon Enterprise, Inc. vs Pool Corporation Trends and Insights
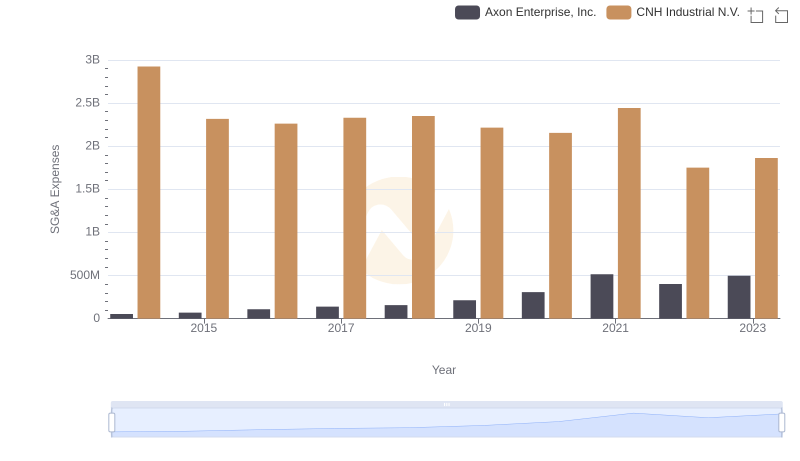
Operational Costs Compared: SG&A Analysis of Axon Enterprise, Inc. and CNH Industrial N.V.
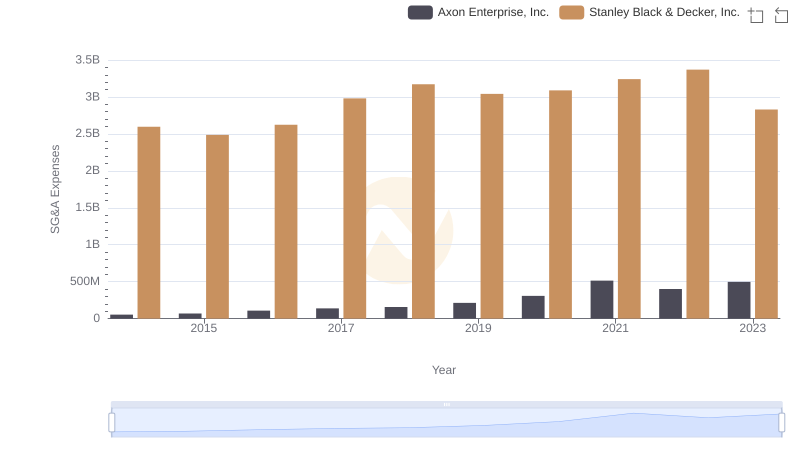
Axon Enterprise, Inc. vs Stanley Black & Decker, Inc.: SG&A Expense Trends
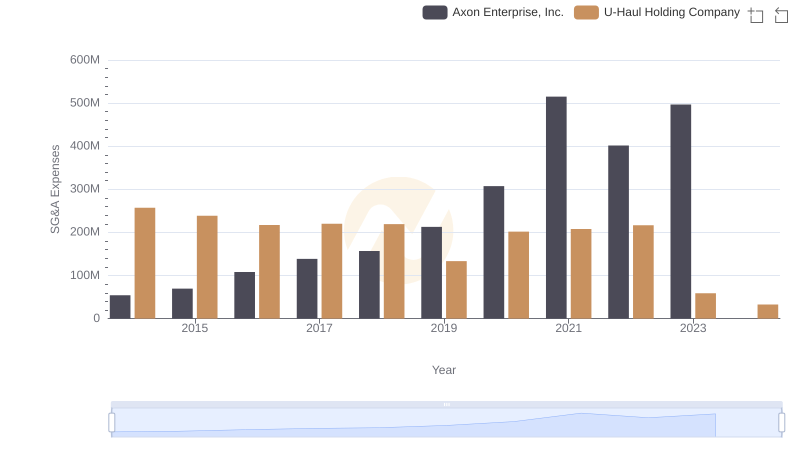
Cost Management Insights: SG&A Expenses for Axon Enterprise, Inc. and U-Haul Holding Company
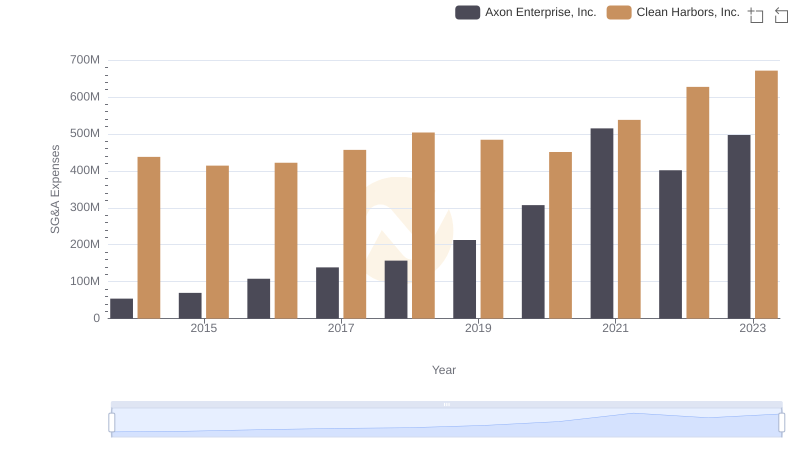
Comparing SG&A Expenses: Axon Enterprise, Inc. vs Clean Harbors, Inc. Trends and Insights