| __timestamp | L3Harris Technologies, Inc. | United Rentals, Inc. |
|---|---|---|
| Wednesday, January 1, 2014 | 2370000000 | 3253000000 |
| Thursday, January 1, 2015 | 3832000000 | 3337000000 |
| Friday, January 1, 2016 | 3854000000 | 3359000000 |
| Sunday, January 1, 2017 | 4066000000 | 3872000000 |
| Monday, January 1, 2018 | 4467000000 | 4683000000 |
| Tuesday, January 1, 2019 | 13452000000 | 5681000000 |
| Wednesday, January 1, 2020 | 12886000000 | 5347000000 |
| Friday, January 1, 2021 | 12438000000 | 5863000000 |
| Saturday, January 1, 2022 | 12135000000 | 6646000000 |
| Sunday, January 1, 2023 | 14306000000 | 8519000000 |
| Monday, January 1, 2024 | 15801000000 | 9195000000 |
Unveiling the hidden dimensions of data
In the competitive landscape of American industry, cost efficiency is a critical metric. This analysis delves into the cost of revenue trends for United Rentals, Inc. and L3Harris Technologies, Inc. from 2014 to 2023. Over this period, L3Harris Technologies saw a staggering 504% increase in their cost of revenue, peaking in 2023. Meanwhile, United Rentals experienced a 182% rise, with a notable surge in 2024, despite missing data for L3Harris that year.
United Rentals consistently maintained a lower cost of revenue compared to L3Harris, highlighting their operational efficiency. The data suggests that while both companies have grown, United Rentals has managed its cost structure more effectively. This insight is crucial for investors and industry analysts seeking to understand the financial health and strategic positioning of these two industrial giants.
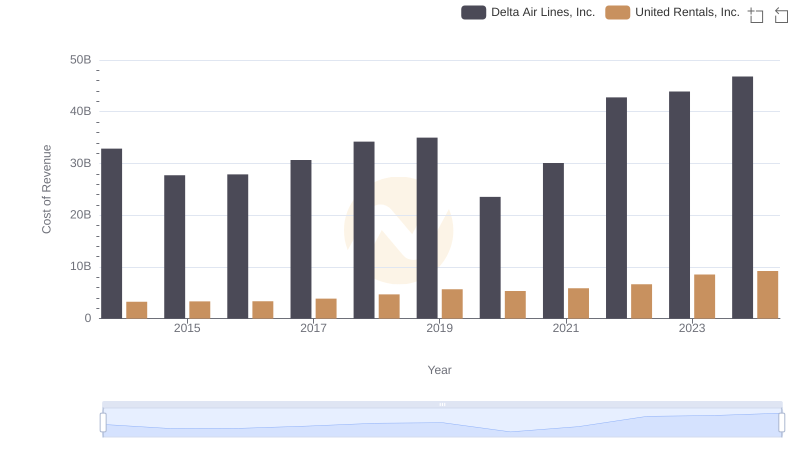
Cost Insights: Breaking Down United Rentals, Inc. and Delta Air Lines, Inc.'s Expenses
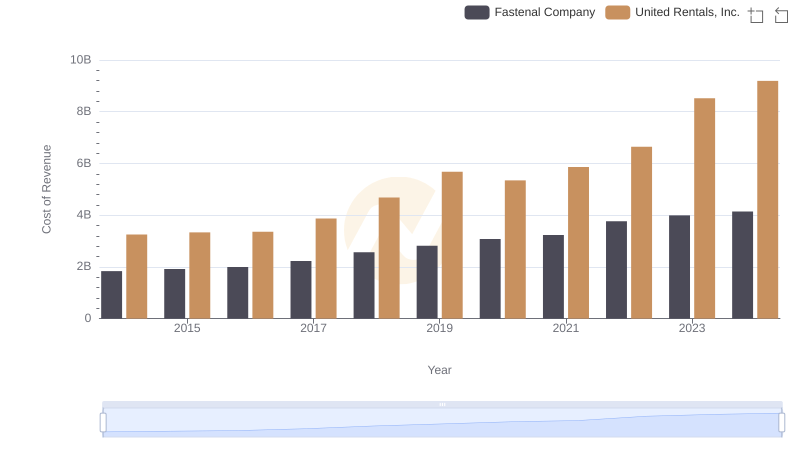
Cost Insights: Breaking Down United Rentals, Inc. and Fastenal Company's Expenses
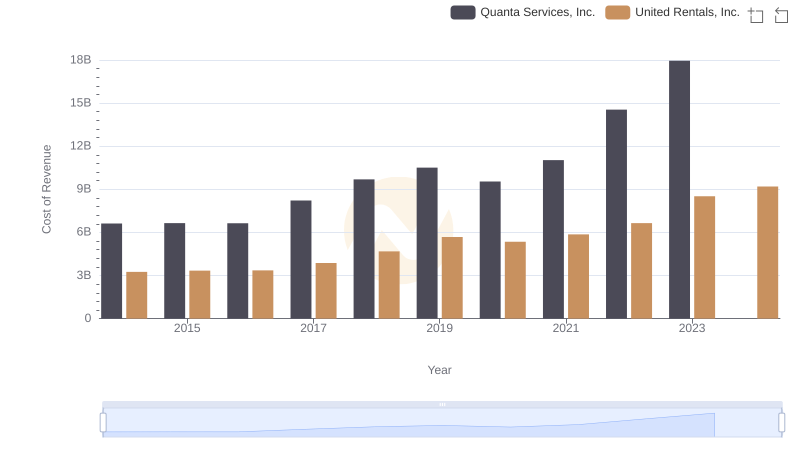
United Rentals, Inc. vs Quanta Services, Inc.: Efficiency in Cost of Revenue Explored
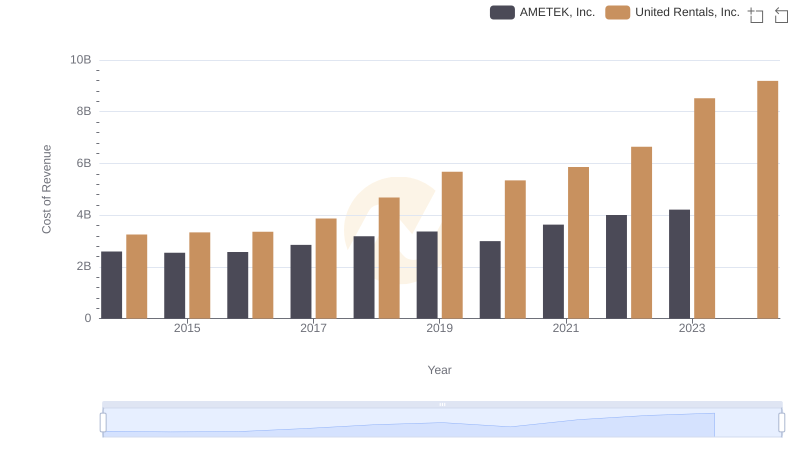
Comparing Cost of Revenue Efficiency: United Rentals, Inc. vs AMETEK, Inc.
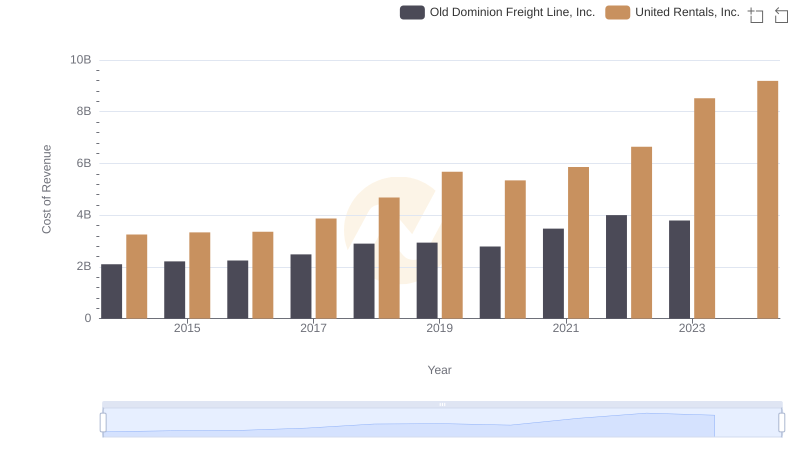
United Rentals, Inc. vs Old Dominion Freight Line, Inc.: Efficiency in Cost of Revenue Explored
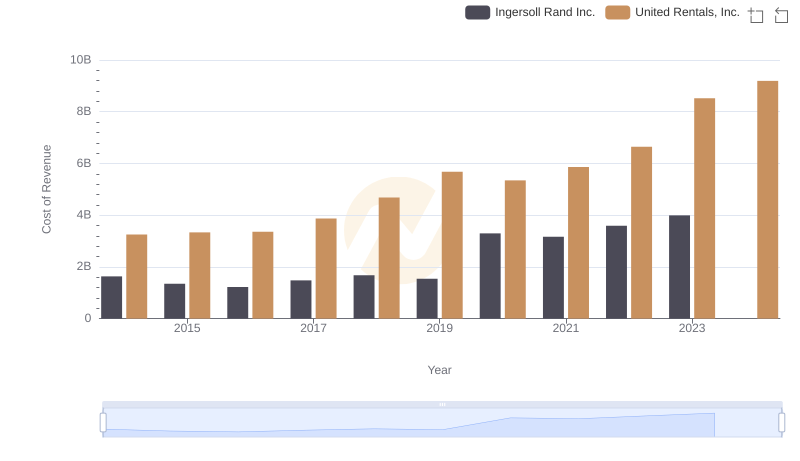
Cost of Revenue Trends: United Rentals, Inc. vs Ingersoll Rand Inc.
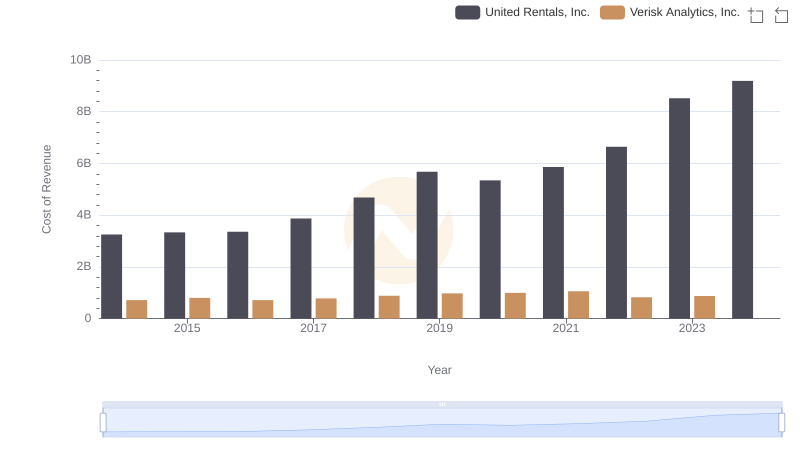
Cost of Revenue Comparison: United Rentals, Inc. vs Verisk Analytics, Inc.
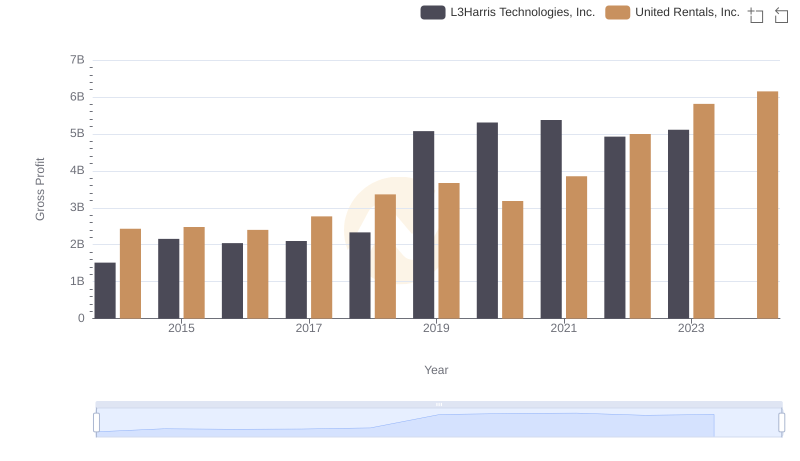
United Rentals, Inc. vs L3Harris Technologies, Inc.: A Gross Profit Performance Breakdown
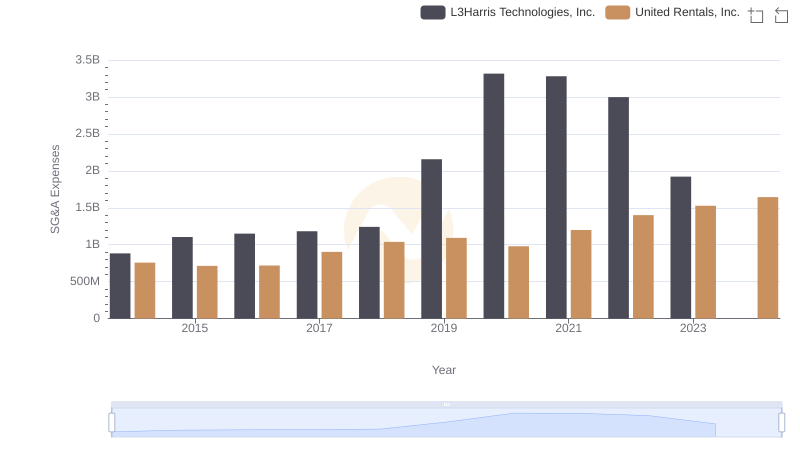
United Rentals, Inc. vs L3Harris Technologies, Inc.: SG&A Expense Trends
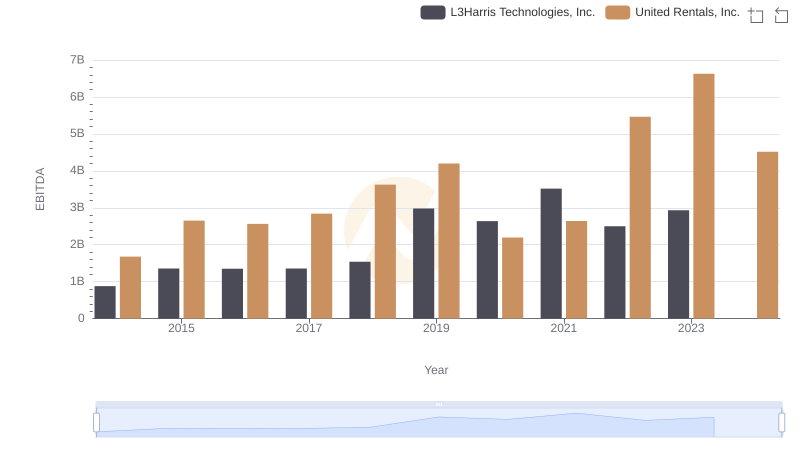
A Professional Review of EBITDA: United Rentals, Inc. Compared to L3Harris Technologies, Inc.