| __timestamp | Howmet Aerospace Inc. | United Rentals, Inc. |
|---|---|---|
| Wednesday, January 1, 2014 | 10349000000 | 3253000000 |
| Thursday, January 1, 2015 | 10104000000 | 3337000000 |
| Friday, January 1, 2016 | 9806000000 | 3359000000 |
| Sunday, January 1, 2017 | 10357000000 | 3872000000 |
| Monday, January 1, 2018 | 11397000000 | 4683000000 |
| Tuesday, January 1, 2019 | 11227000000 | 5681000000 |
| Wednesday, January 1, 2020 | 3878000000 | 5347000000 |
| Friday, January 1, 2021 | 3596000000 | 5863000000 |
| Saturday, January 1, 2022 | 4103000000 | 6646000000 |
| Sunday, January 1, 2023 | 4773000000 | 8519000000 |
| Monday, January 1, 2024 | 5119000000 | 9195000000 |
Data in motion
In the ever-evolving landscape of industrial giants, understanding cost dynamics is crucial. From 2014 to 2023, Howmet Aerospace Inc. and United Rentals, Inc. have showcased intriguing trends in their cost of revenue. Howmet Aerospace, with its roots in advanced engineering solutions, saw a significant decline in cost of revenue by 65% from 2019 to 2020, reflecting strategic cost management. Meanwhile, United Rentals, a leader in equipment rental, experienced a steady increase, with a notable 28% rise from 2022 to 2023, indicating expansion and increased operational scale.
The data reveals a missing entry for Howmet Aerospace in 2024, suggesting potential reporting delays or strategic shifts. These insights provide a window into the financial strategies of these industrial titans, offering valuable lessons in cost management and growth adaptation.

United Rentals, Inc. and Howmet Aerospace Inc.: A Comprehensive Revenue Analysis
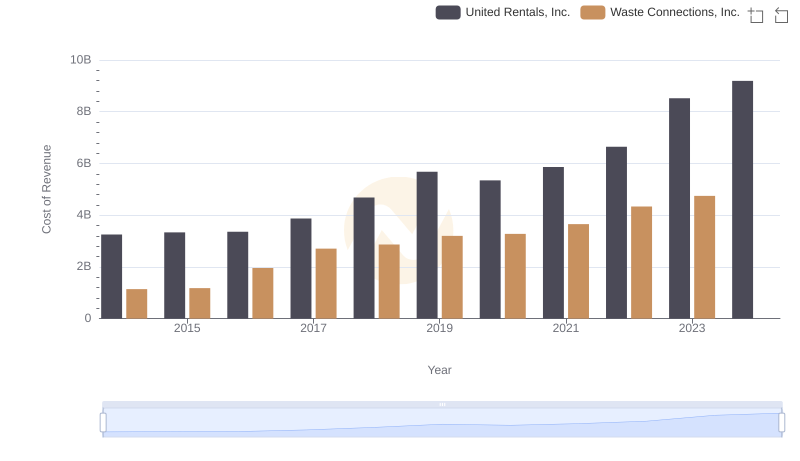
Analyzing Cost of Revenue: United Rentals, Inc. and Waste Connections, Inc.
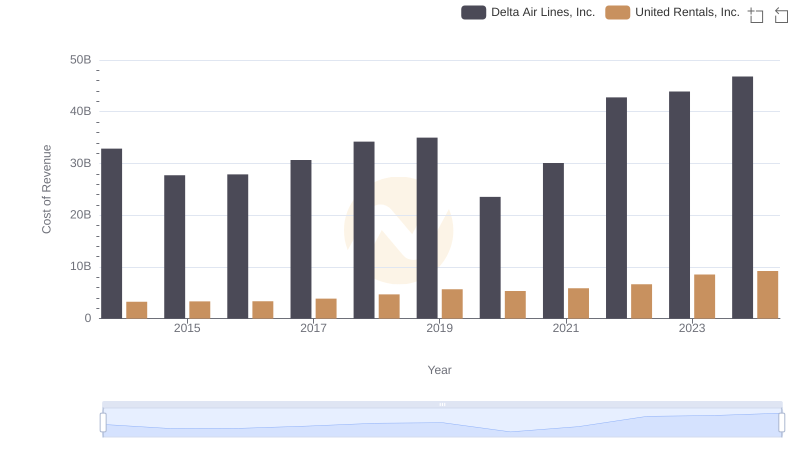
Cost Insights: Breaking Down United Rentals, Inc. and Delta Air Lines, Inc.'s Expenses
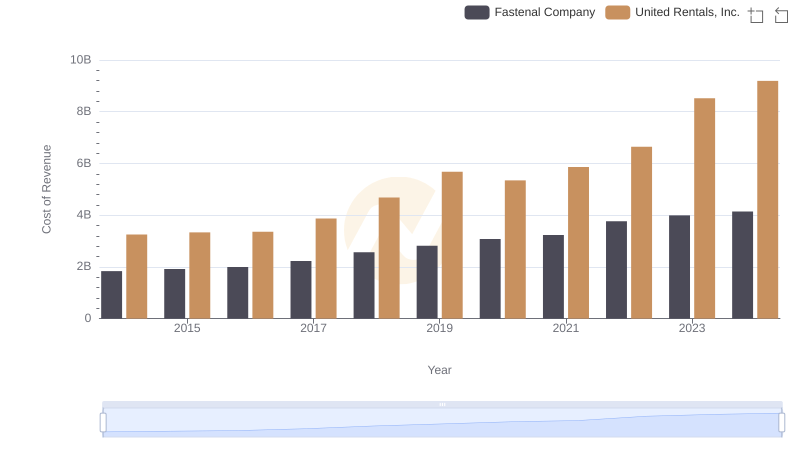
Cost Insights: Breaking Down United Rentals, Inc. and Fastenal Company's Expenses
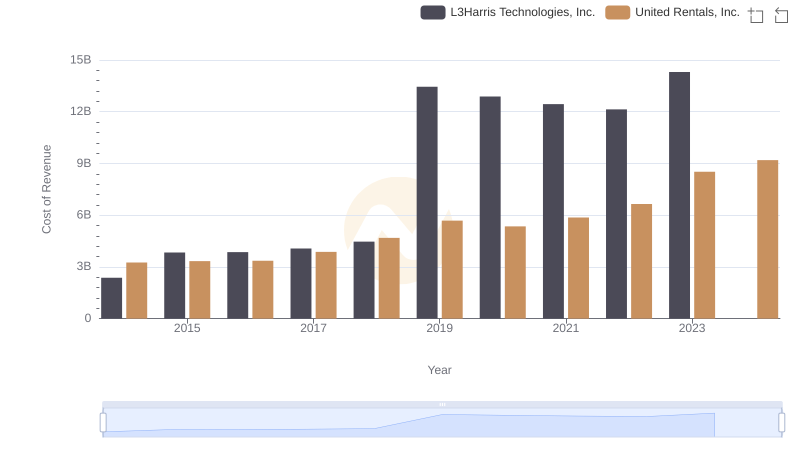
United Rentals, Inc. vs L3Harris Technologies, Inc.: Efficiency in Cost of Revenue Explored
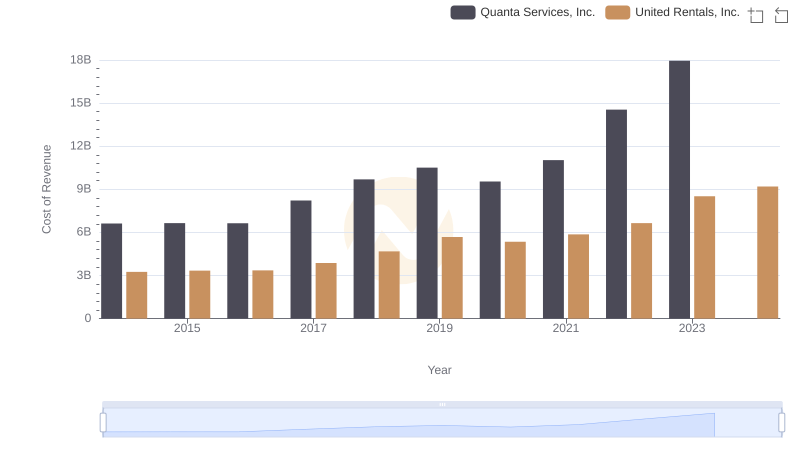
United Rentals, Inc. vs Quanta Services, Inc.: Efficiency in Cost of Revenue Explored
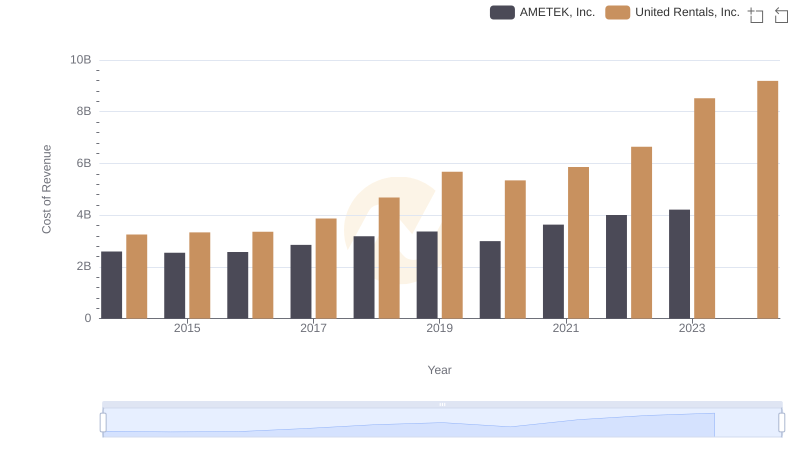
Comparing Cost of Revenue Efficiency: United Rentals, Inc. vs AMETEK, Inc.
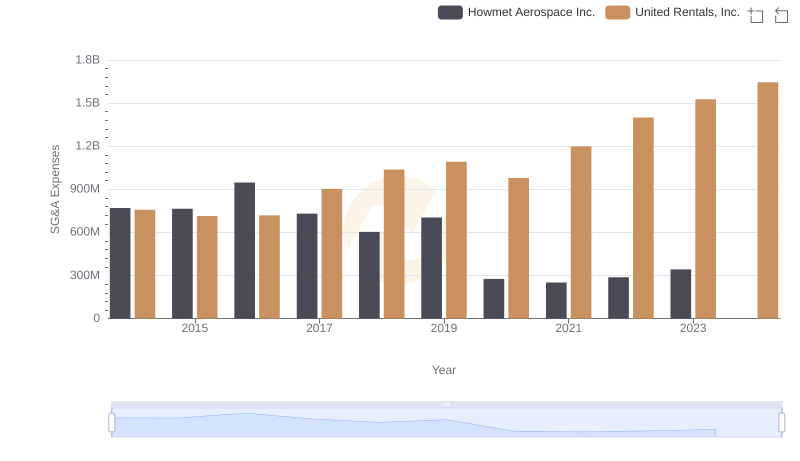
Operational Costs Compared: SG&A Analysis of United Rentals, Inc. and Howmet Aerospace Inc.
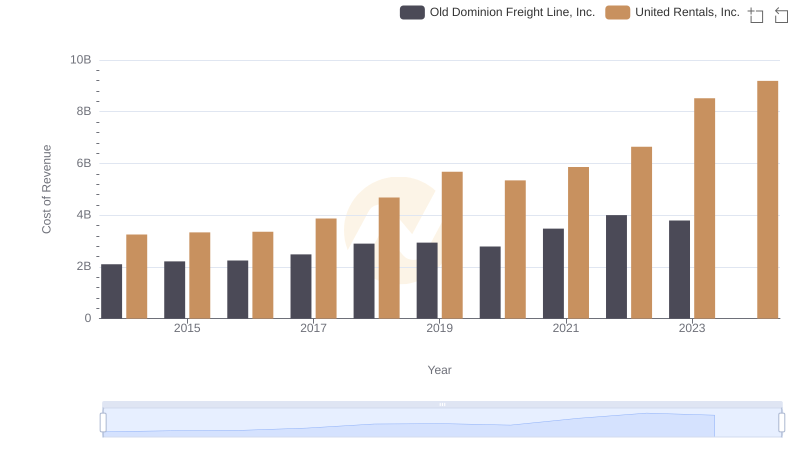
United Rentals, Inc. vs Old Dominion Freight Line, Inc.: Efficiency in Cost of Revenue Explored
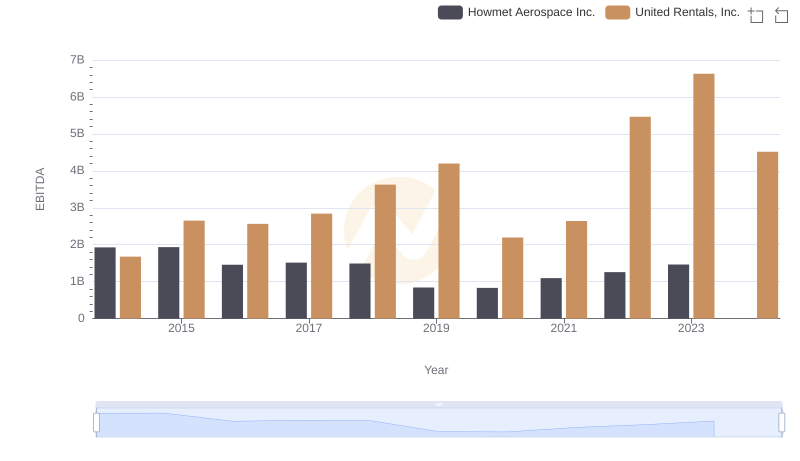
A Side-by-Side Analysis of EBITDA: United Rentals, Inc. and Howmet Aerospace Inc.