| __timestamp | United Rentals, Inc. | Waste Connections, Inc. |
|---|---|---|
| Wednesday, January 1, 2014 | 3253000000 | 1138388000 |
| Thursday, January 1, 2015 | 3337000000 | 1177409000 |
| Friday, January 1, 2016 | 3359000000 | 1957712000 |
| Sunday, January 1, 2017 | 3872000000 | 2704775000 |
| Monday, January 1, 2018 | 4683000000 | 2865704000 |
| Tuesday, January 1, 2019 | 5681000000 | 3198757000 |
| Wednesday, January 1, 2020 | 5347000000 | 3276808000 |
| Friday, January 1, 2021 | 5863000000 | 3654074000 |
| Saturday, January 1, 2022 | 6646000000 | 4336012000 |
| Sunday, January 1, 2023 | 8519000000 | 4744513000 |
| Monday, January 1, 2024 | 9195000000 | 5191706000 |
Cracking the code
In the ever-evolving landscape of industrial services, understanding cost dynamics is crucial. Over the past decade, United Rentals, Inc. and Waste Connections, Inc. have shown distinct trends in their cost of revenue. From 2014 to 2023, United Rentals experienced a staggering 183% increase in costs, peaking at $9.2 billion in 2024. This reflects their aggressive expansion and market penetration strategies. In contrast, Waste Connections saw a 317% rise, reaching $4.7 billion by 2023, indicating robust growth in waste management services. Notably, 2024 data for Waste Connections is missing, suggesting potential reporting delays or strategic shifts. These trends highlight the dynamic nature of cost management in industrial sectors, offering insights into operational efficiencies and market strategies. As these companies navigate future challenges, their cost structures will remain pivotal in shaping their competitive edge.

Comparing Revenue Performance: United Rentals, Inc. or Waste Connections, Inc.?
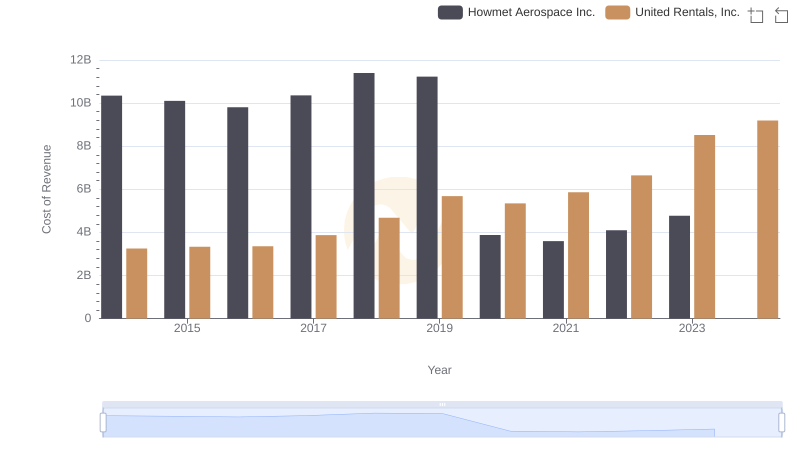
Analyzing Cost of Revenue: United Rentals, Inc. and Howmet Aerospace Inc.
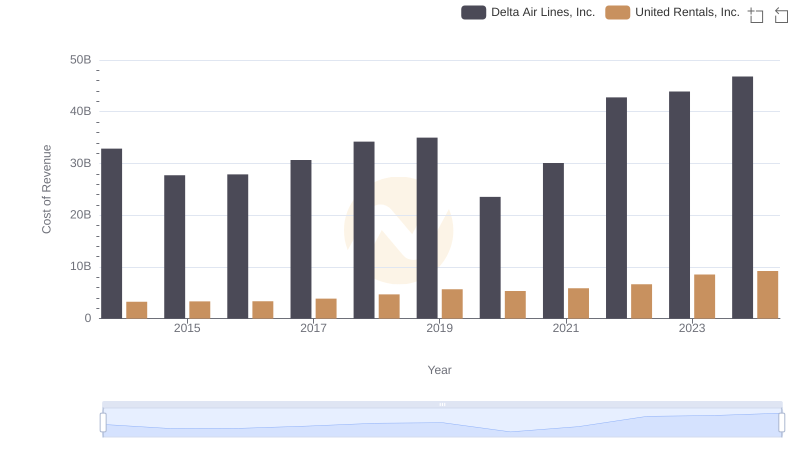
Cost Insights: Breaking Down United Rentals, Inc. and Delta Air Lines, Inc.'s Expenses
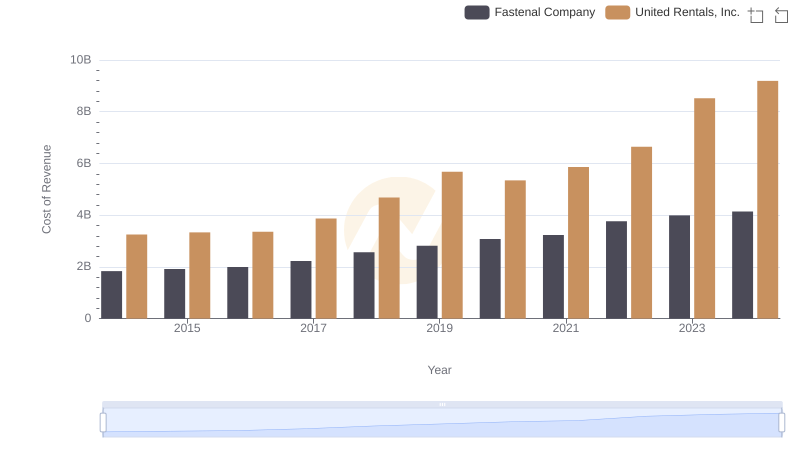
Cost Insights: Breaking Down United Rentals, Inc. and Fastenal Company's Expenses
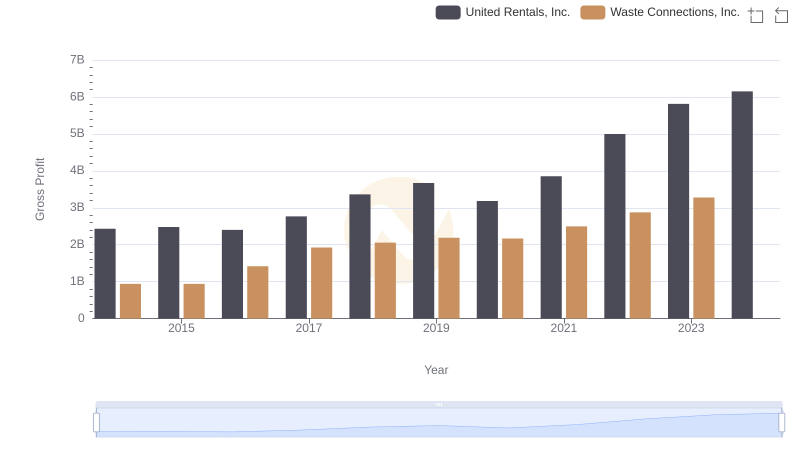
Gross Profit Trends Compared: United Rentals, Inc. vs Waste Connections, Inc.
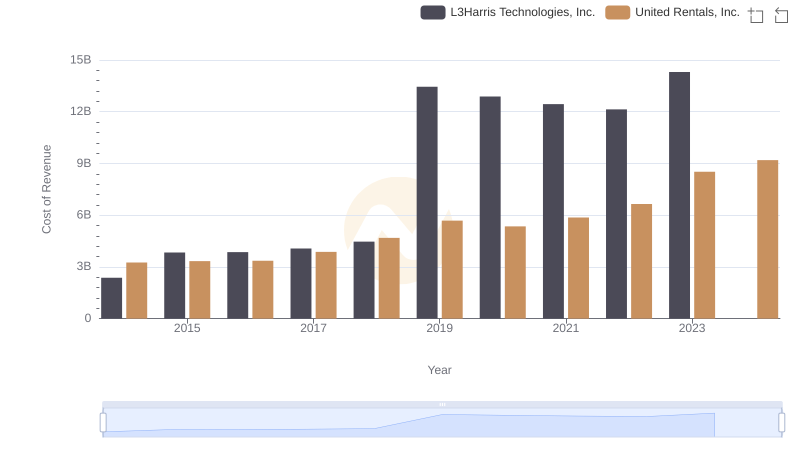
United Rentals, Inc. vs L3Harris Technologies, Inc.: Efficiency in Cost of Revenue Explored
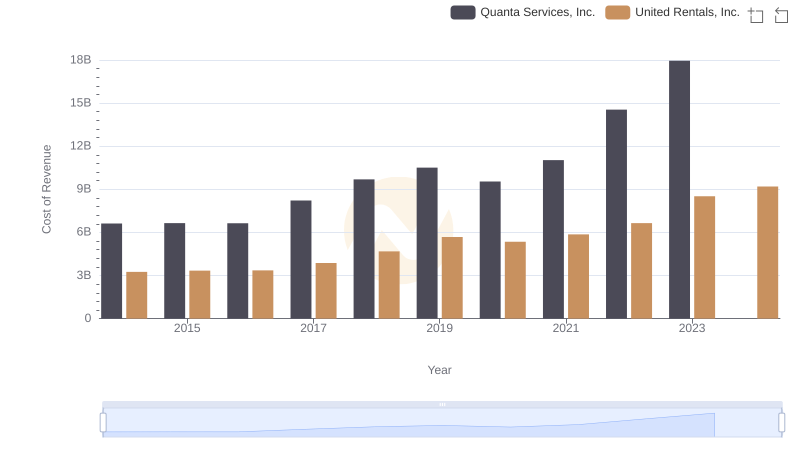
United Rentals, Inc. vs Quanta Services, Inc.: Efficiency in Cost of Revenue Explored
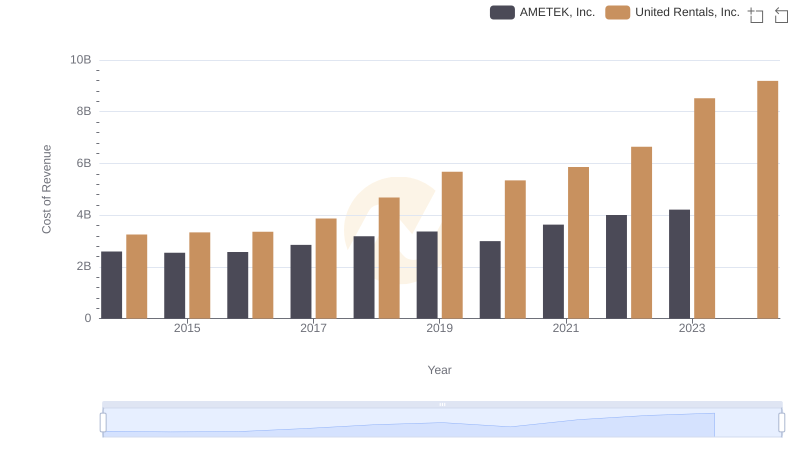
Comparing Cost of Revenue Efficiency: United Rentals, Inc. vs AMETEK, Inc.
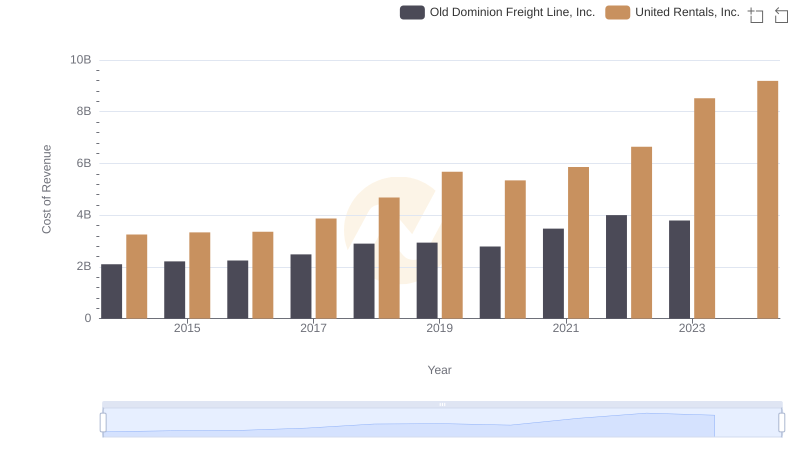
United Rentals, Inc. vs Old Dominion Freight Line, Inc.: Efficiency in Cost of Revenue Explored
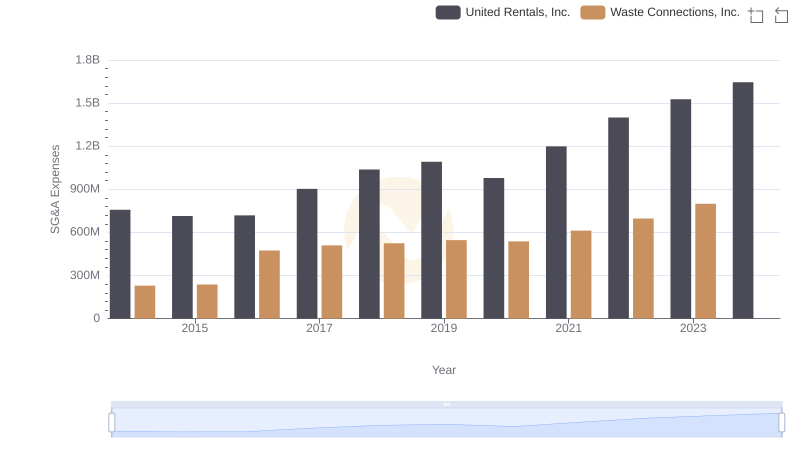
Selling, General, and Administrative Costs: United Rentals, Inc. vs Waste Connections, Inc.
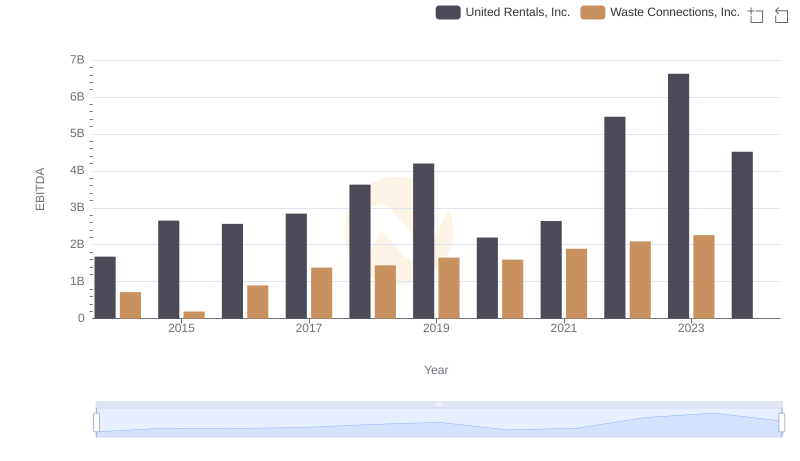
Comparative EBITDA Analysis: United Rentals, Inc. vs Waste Connections, Inc.