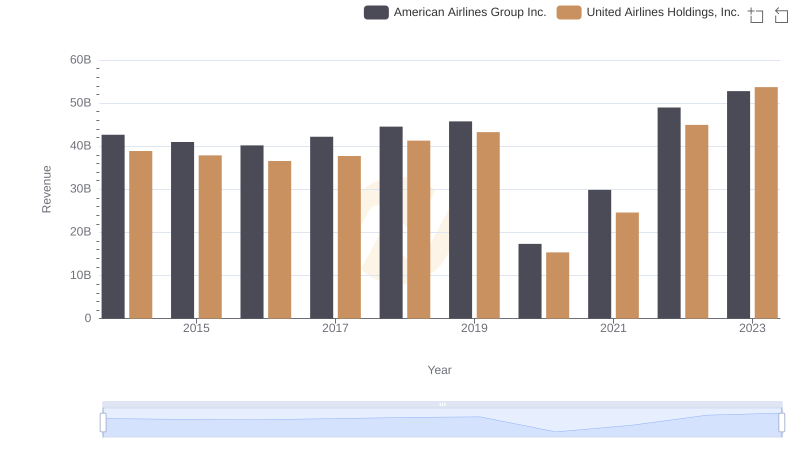
| __timestamp | American Airlines Group Inc. | United Airlines Holdings, Inc. |
|---|---|---|
| Wednesday, January 1, 2014 | 31939000000 | 29569000000 |
| Thursday, January 1, 2015 | 27967000000 | 25952000000 |
| Friday, January 1, 2016 | 28339000000 | 24856000000 |
| Sunday, January 1, 2017 | 31154000000 | 27056000000 |
| Monday, January 1, 2018 | 34490000000 | 30165000000 |
| Tuesday, January 1, 2019 | 35379000000 | 30786000000 |
| Wednesday, January 1, 2020 | 24933000000 | 20385000000 |
| Friday, January 1, 2021 | 29855000000 | 23913000000 |
| Saturday, January 1, 2022 | 39934000000 | 34315000000 |
| Sunday, January 1, 2023 | 40978000000 | 38518000000 |
| Monday, January 1, 2024 | 37643000000 |
Infusing magic into the data realm
In the competitive skies of the airline industry, understanding cost dynamics is crucial. Over the past decade, American Airlines Group Inc. and United Airlines Holdings, Inc. have navigated turbulent financial landscapes. From 2014 to 2023, American Airlines consistently reported higher costs of revenue, peaking in 2023 with a 28% increase from 2014. United Airlines, while trailing slightly, showed a similar upward trend, with a 30% rise in the same period.
The year 2020 marked a significant dip for both airlines, reflecting the global impact of the COVID-19 pandemic. However, by 2023, both companies rebounded, with American Airlines reaching its highest cost of revenue, indicating a robust recovery. This data not only highlights the resilience of these aviation giants but also underscores the importance of strategic cost management in the face of global challenges.

Comparing Cost of Revenue Efficiency: United Airlines Holdings, Inc. vs Saia, Inc.
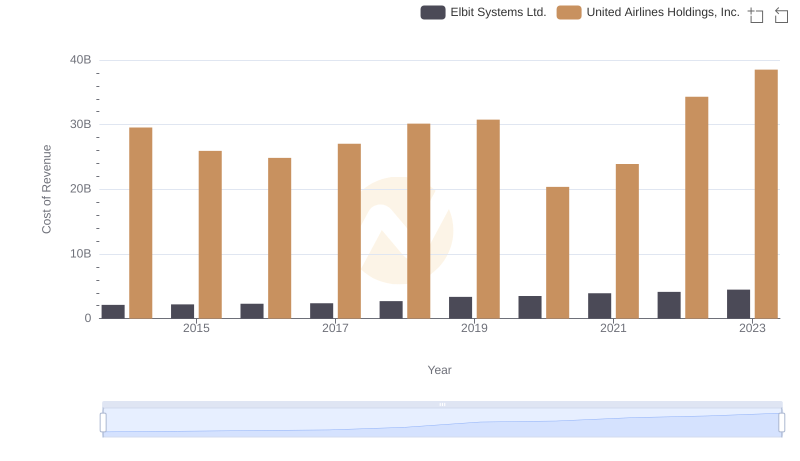
Cost Insights: Breaking Down United Airlines Holdings, Inc. and Elbit Systems Ltd.'s Expenses
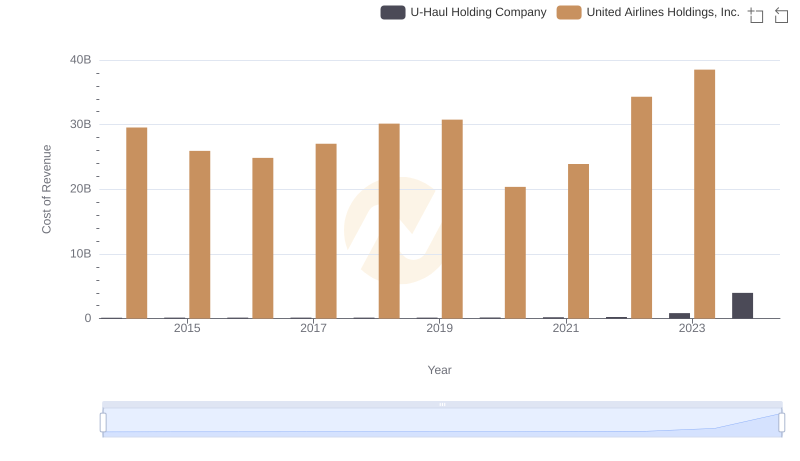
Cost of Revenue: Key Insights for United Airlines Holdings, Inc. and U-Haul Holding Company
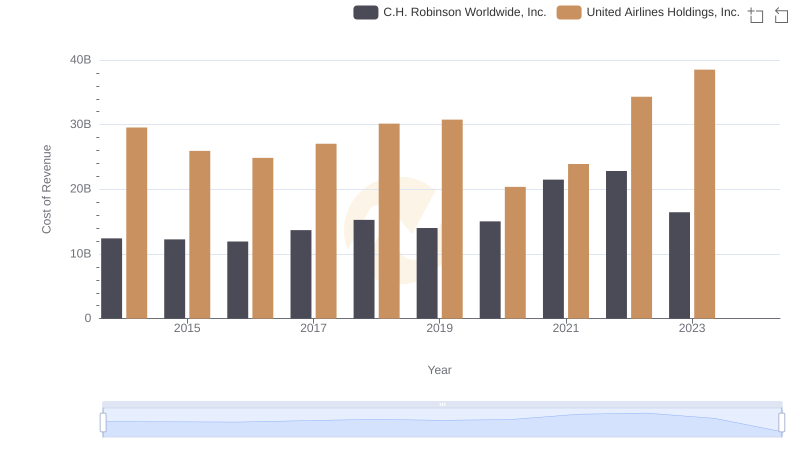
Cost of Revenue Comparison: United Airlines Holdings, Inc. vs C.H. Robinson Worldwide, Inc.
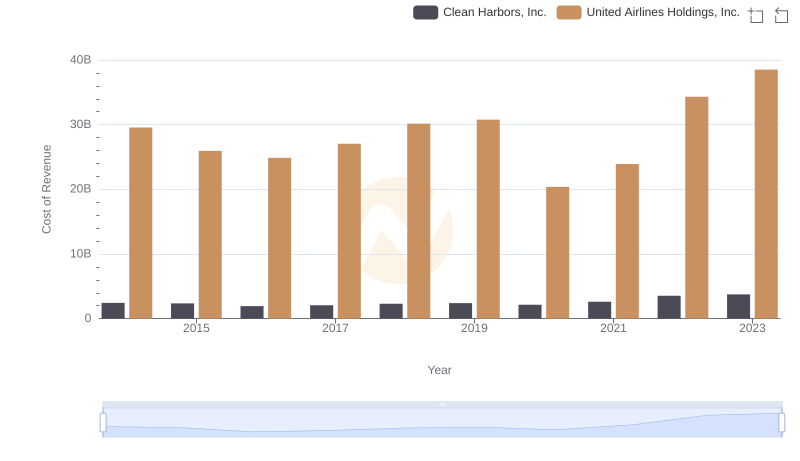
Cost Insights: Breaking Down United Airlines Holdings, Inc. and Clean Harbors, Inc.'s Expenses
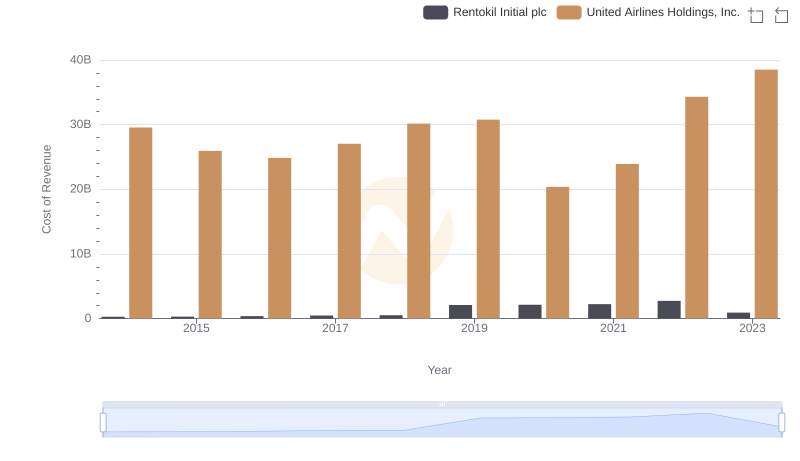
Comparing Cost of Revenue Efficiency: United Airlines Holdings, Inc. vs Rentokil Initial plc
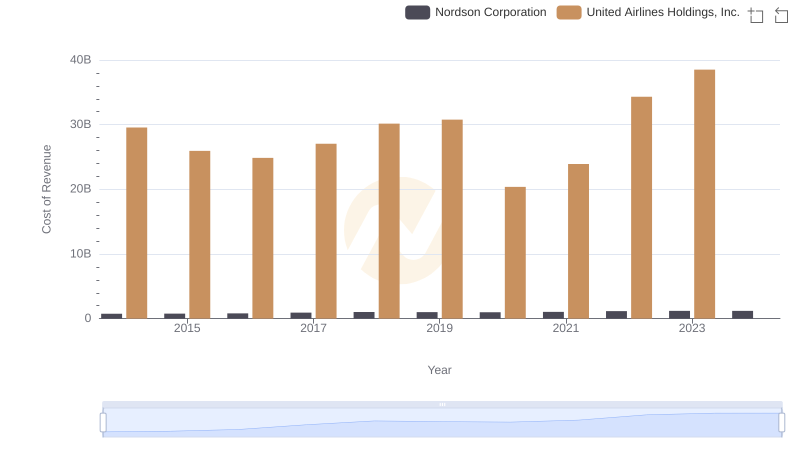
Comparing Cost of Revenue Efficiency: United Airlines Holdings, Inc. vs Nordson Corporation
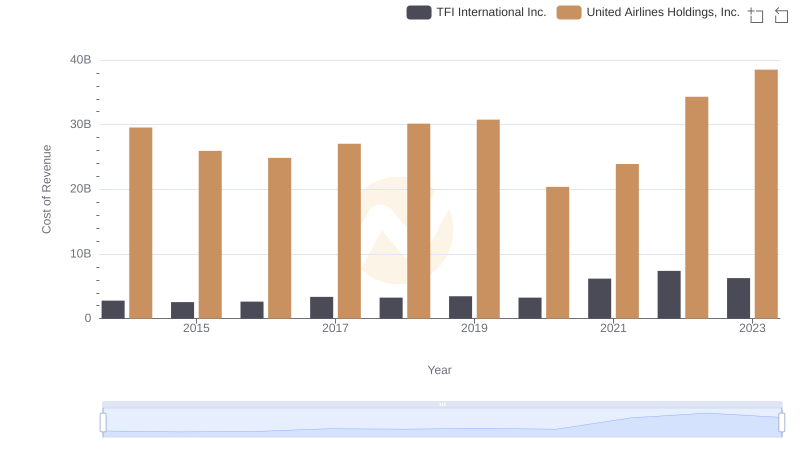
Cost of Revenue Comparison: United Airlines Holdings, Inc. vs TFI International Inc.
Comparing Revenue Performance: United Airlines Holdings, Inc. or American Airlines Group Inc.?
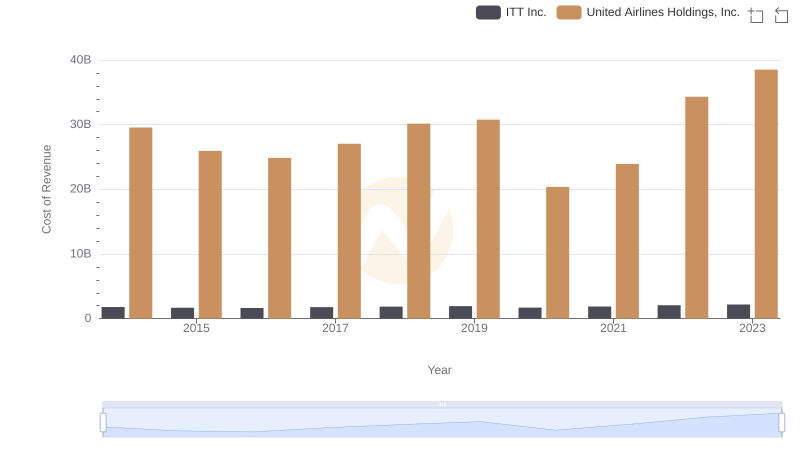
Analyzing Cost of Revenue: United Airlines Holdings, Inc. and ITT Inc.
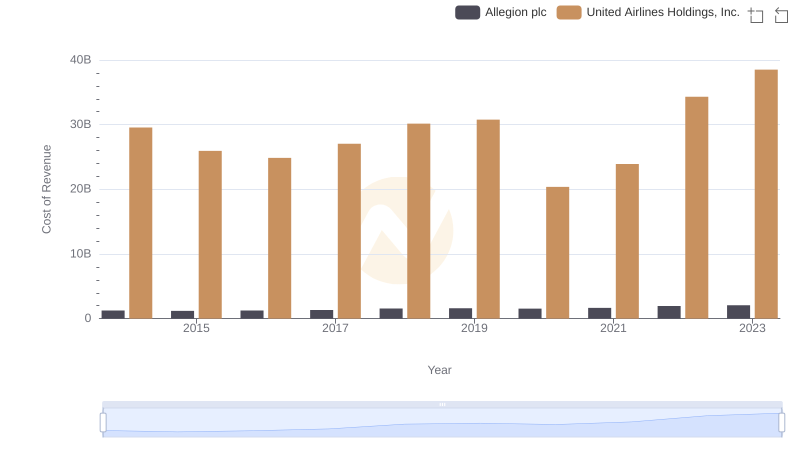
Comparing Cost of Revenue Efficiency: United Airlines Holdings, Inc. vs Allegion plc
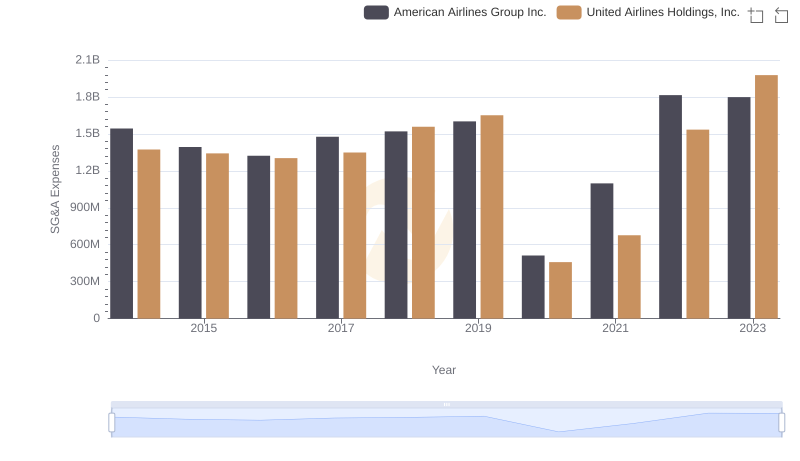
Cost Management Insights: SG&A Expenses for United Airlines Holdings, Inc. and American Airlines Group Inc.