| __timestamp | American Airlines Group Inc. | United Airlines Holdings, Inc. |
|---|---|---|
| Wednesday, January 1, 2014 | 42650000000 | 38901000000 |
| Thursday, January 1, 2015 | 40990000000 | 37864000000 |
| Friday, January 1, 2016 | 40180000000 | 36556000000 |
| Sunday, January 1, 2017 | 42207000000 | 37736000000 |
| Monday, January 1, 2018 | 44541000000 | 41303000000 |
| Tuesday, January 1, 2019 | 45768000000 | 43259000000 |
| Wednesday, January 1, 2020 | 17337000000 | 15355000000 |
| Friday, January 1, 2021 | 29882000000 | 24634000000 |
| Saturday, January 1, 2022 | 48971000000 | 44955000000 |
| Sunday, January 1, 2023 | 52788000000 | 53717000000 |
| Monday, January 1, 2024 | 57063000000 |
Data in motion
In the competitive skies of the airline industry, United Airlines Holdings, Inc. and American Airlines Group Inc. have been vying for dominance. Over the past decade, these two giants have shown remarkable resilience and adaptability. From 2014 to 2023, American Airlines consistently outperformed United Airlines in revenue, except in 2023 when United took the lead with a 2% higher revenue.
The COVID-19 pandemic in 2020 was a significant disruptor, with both airlines experiencing a dramatic revenue drop of over 60% compared to 2019. However, the recovery was swift. By 2022, American Airlines had rebounded to nearly 115% of its pre-pandemic revenue, while United Airlines reached 104%.
As we look to the future, the 2023 data suggests a promising trajectory for both airlines, with United Airlines showing a slight edge. The competition remains fierce, and the skies are the limit.
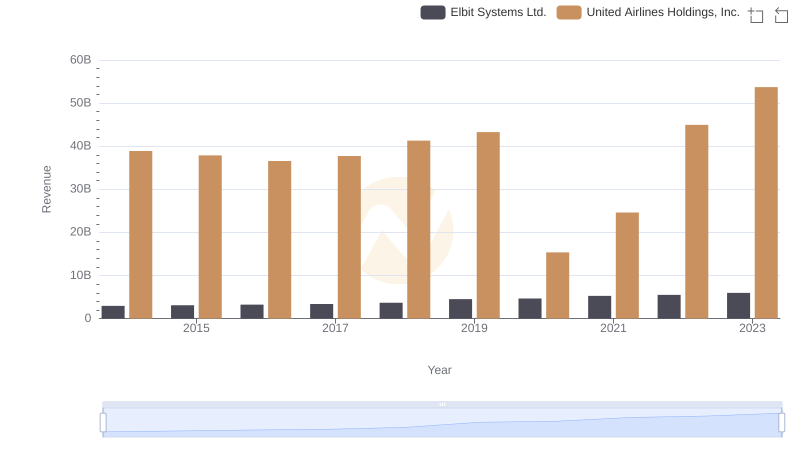
United Airlines Holdings, Inc. vs Elbit Systems Ltd.: Examining Key Revenue Metrics
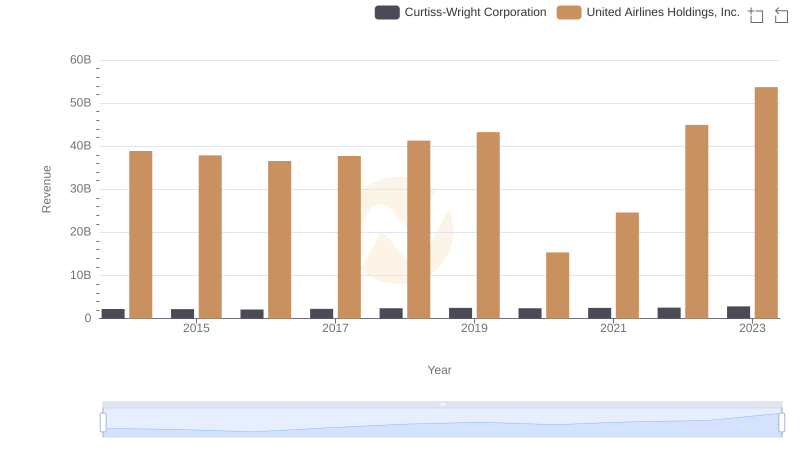
United Airlines Holdings, Inc. vs Curtiss-Wright Corporation: Annual Revenue Growth Compared
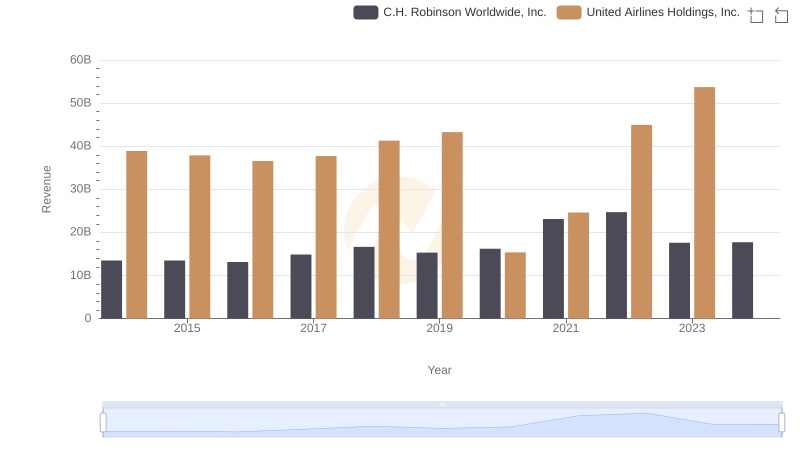
Comparing Revenue Performance: United Airlines Holdings, Inc. or C.H. Robinson Worldwide, Inc.?
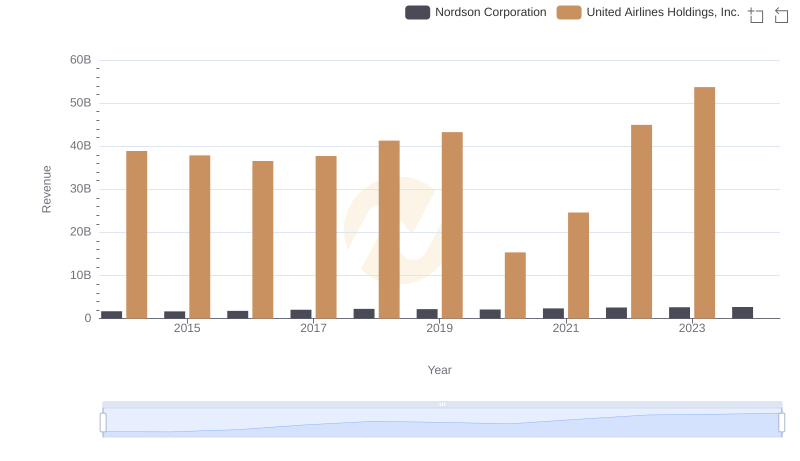
Revenue Insights: United Airlines Holdings, Inc. and Nordson Corporation Performance Compared
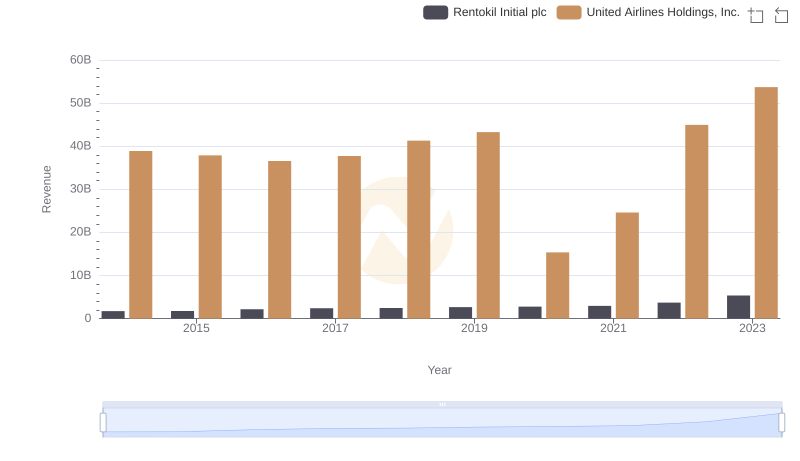
Who Generates More Revenue? United Airlines Holdings, Inc. or Rentokil Initial plc
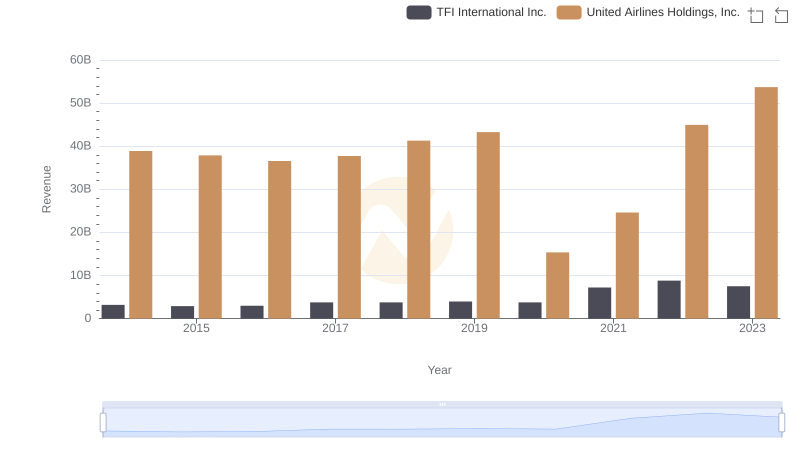
Who Generates More Revenue? United Airlines Holdings, Inc. or TFI International Inc.
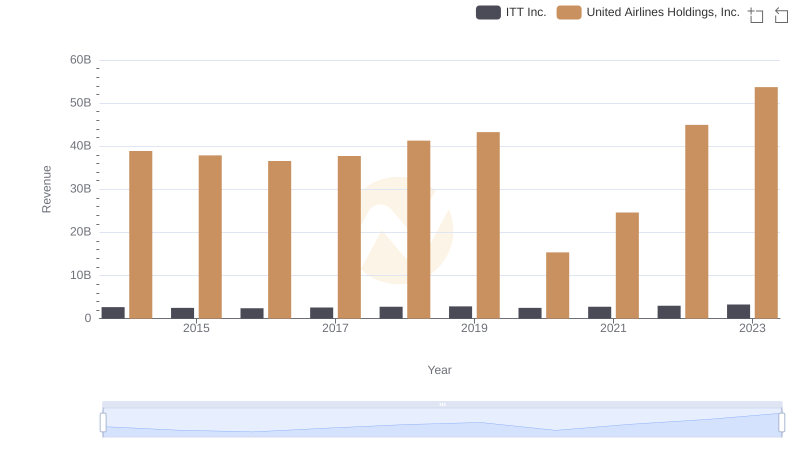
Revenue Showdown: United Airlines Holdings, Inc. vs ITT Inc.
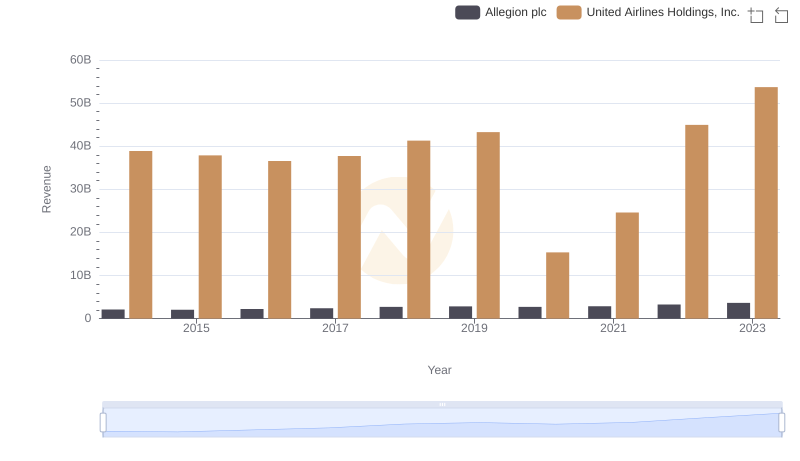
United Airlines Holdings, Inc. and Allegion plc: A Comprehensive Revenue Analysis
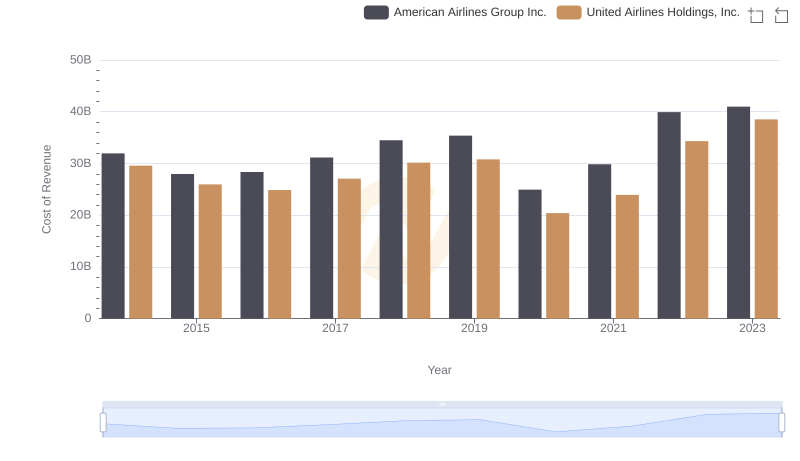
Cost Insights: Breaking Down United Airlines Holdings, Inc. and American Airlines Group Inc.'s Expenses
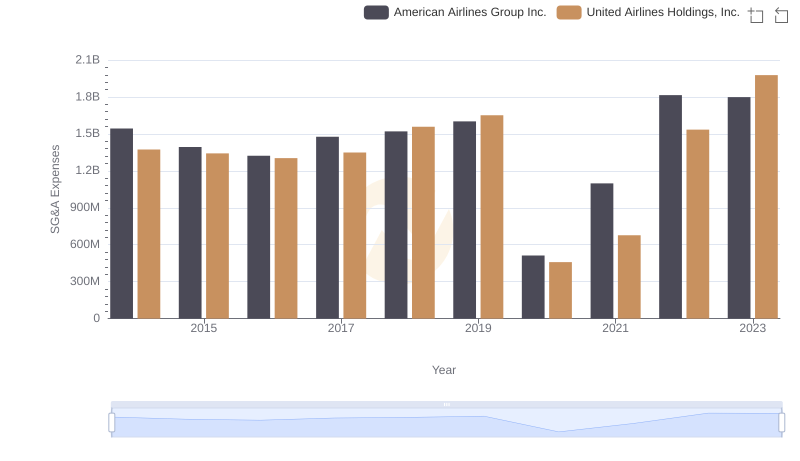
Cost Management Insights: SG&A Expenses for United Airlines Holdings, Inc. and American Airlines Group Inc.