| __timestamp | Axon Enterprise, Inc. | RB Global, Inc. |
|---|---|---|
| Wednesday, January 1, 2014 | 164525000 | 481097000 |
| Thursday, January 1, 2015 | 197892000 | 515875000 |
| Friday, January 1, 2016 | 268245000 | 566395000 |
| Sunday, January 1, 2017 | 343798000 | 610517000 |
| Monday, January 1, 2018 | 420068000 | 1170026000 |
| Tuesday, January 1, 2019 | 530860000 | 1318641000 |
| Wednesday, January 1, 2020 | 681003000 | 1377260000 |
| Friday, January 1, 2021 | 863381000 | 1416971000 |
| Saturday, January 1, 2022 | 1189935000 | 1733808000 |
| Sunday, January 1, 2023 | 1563391000 | 3679600000 |
| Monday, January 1, 2024 | 4284200000 |
Data in motion
In the dynamic world of business, understanding revenue trends is crucial for investors and stakeholders. Over the past decade, Axon Enterprise, Inc. and RB Global, Inc. have shown remarkable growth in their annual revenues. Starting in 2014, Axon Enterprise's revenue was approximately 165 million USD, while RB Global's was around 481 million USD. Fast forward to 2023, Axon Enterprise's revenue surged by nearly 847%, reaching approximately 1.56 billion USD. Meanwhile, RB Global experienced a 665% increase, with revenues soaring to about 3.68 billion USD. This impressive growth highlights the resilience and strategic prowess of both companies in navigating market challenges. As we delve deeper into these insights, it becomes evident that both companies have successfully capitalized on market opportunities, setting a benchmark for industry peers.
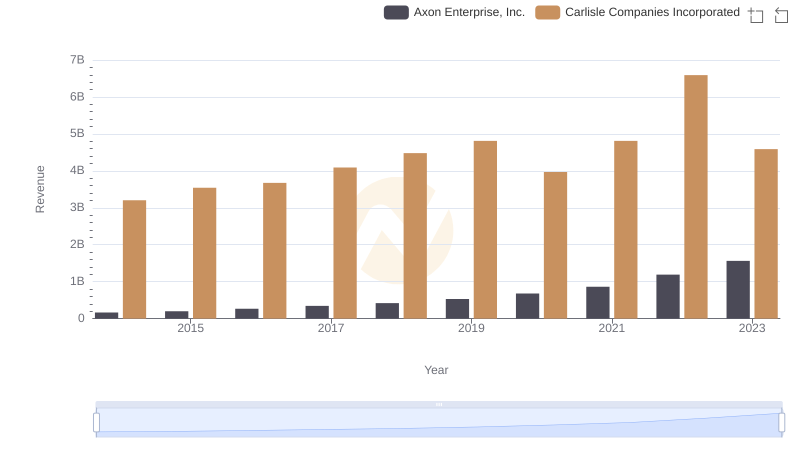
Axon Enterprise, Inc. and Carlisle Companies Incorporated: A Comprehensive Revenue Analysis
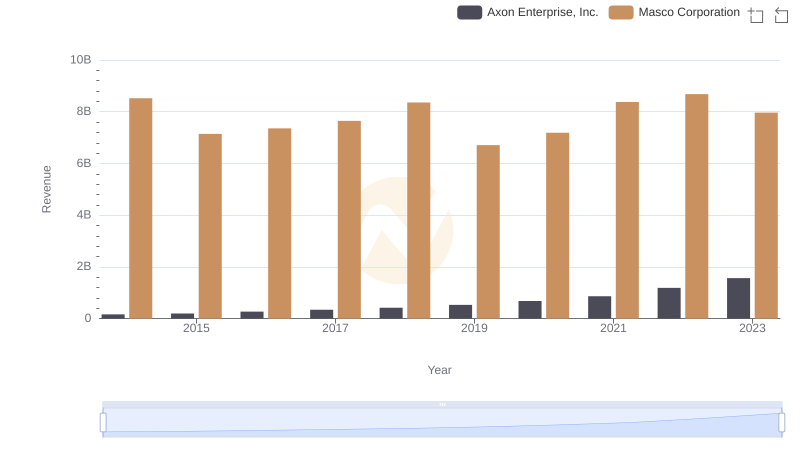
Axon Enterprise, Inc. and Masco Corporation: A Comprehensive Revenue Analysis
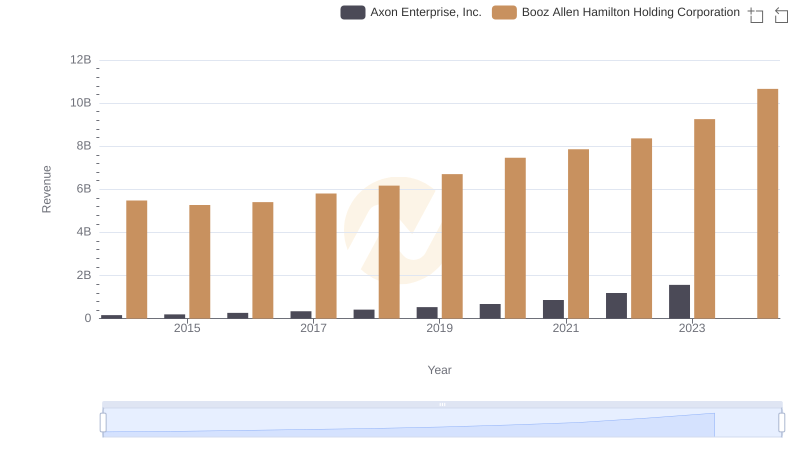
Annual Revenue Comparison: Axon Enterprise, Inc. vs Booz Allen Hamilton Holding Corporation

Axon Enterprise, Inc. vs IDEX Corporation: Examining Key Revenue Metrics
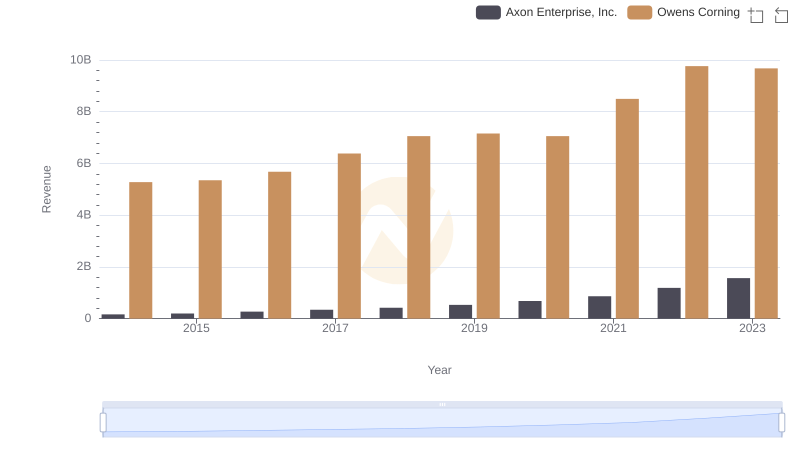
Who Generates More Revenue? Axon Enterprise, Inc. or Owens Corning
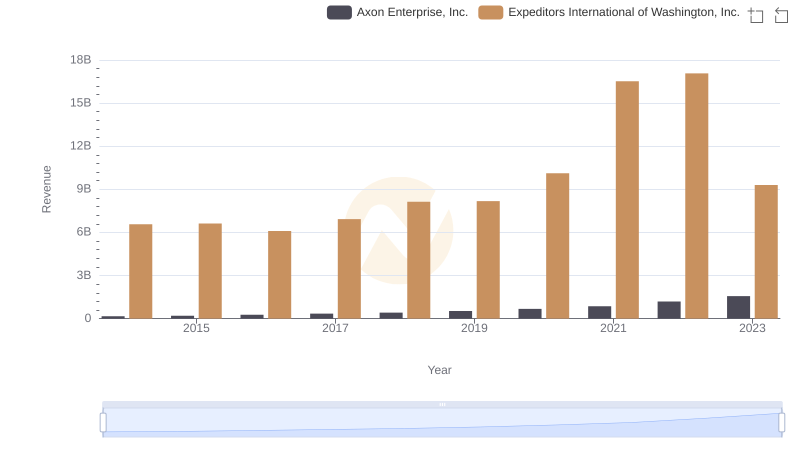
Annual Revenue Comparison: Axon Enterprise, Inc. vs Expeditors International of Washington, Inc.
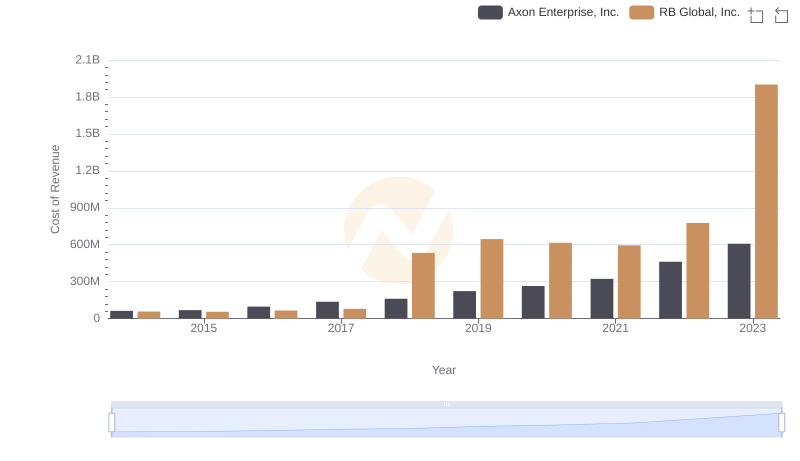
Cost Insights: Breaking Down Axon Enterprise, Inc. and RB Global, Inc.'s Expenses
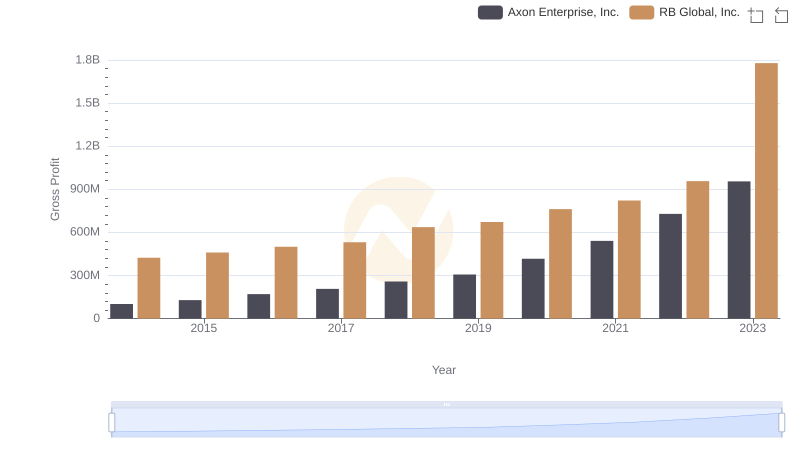
Gross Profit Trends Compared: Axon Enterprise, Inc. vs RB Global, Inc.
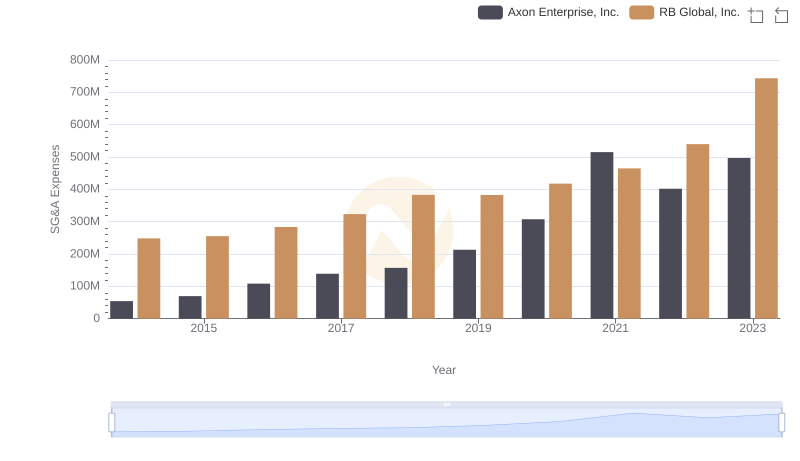
Axon Enterprise, Inc. vs RB Global, Inc.: SG&A Expense Trends