| __timestamp | Axon Enterprise, Inc. | RB Global, Inc. |
|---|---|---|
| Wednesday, January 1, 2014 | 101548000 | 423213000 |
| Thursday, January 1, 2015 | 128647000 | 459849000 |
| Friday, January 1, 2016 | 170536000 | 500333000 |
| Sunday, January 1, 2017 | 207088000 | 531504000 |
| Monday, January 1, 2018 | 258583000 | 636629000 |
| Tuesday, January 1, 2019 | 307286000 | 672825000 |
| Wednesday, January 1, 2020 | 416331000 | 761671000 |
| Friday, January 1, 2021 | 540910000 | 822188000 |
| Saturday, January 1, 2022 | 728638000 | 957107000 |
| Sunday, January 1, 2023 | 955382000 | 1778400000 |
| Monday, January 1, 2024 | 4284200000 |
Unlocking the unknown
In the ever-evolving landscape of the stock market, understanding the financial health of companies is crucial. This analysis delves into the gross profit trends of two industry giants: Axon Enterprise, Inc. and RB Global, Inc., from 2014 to 2023.
Over the past decade, Axon Enterprise, Inc. has seen its gross profit grow by an impressive 840%, starting from $101 million in 2014 to nearly $956 million in 2023. Meanwhile, RB Global, Inc. has experienced a robust 320% increase, with profits rising from $423 million to a staggering $1.78 billion in the same period.
While both companies have shown remarkable growth, RB Global, Inc. consistently outperformed Axon Enterprise, Inc. in terms of absolute gross profit. However, Axon’s rapid growth rate suggests a dynamic shift in its market strategy, potentially positioning it as a formidable competitor in the coming years.
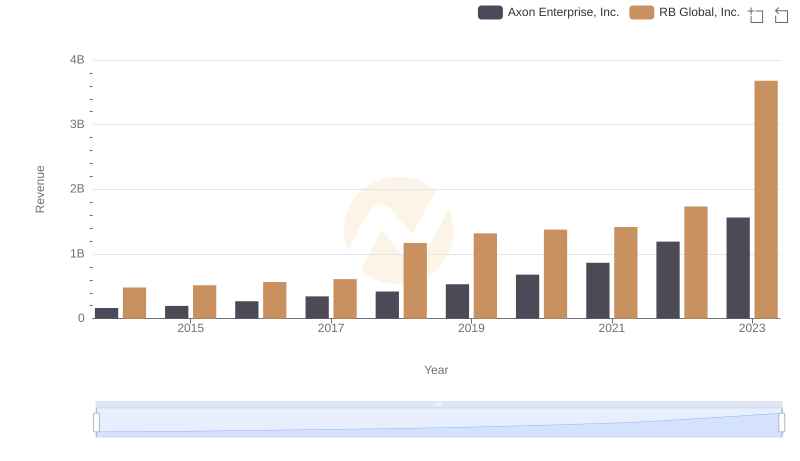
Revenue Insights: Axon Enterprise, Inc. and RB Global, Inc. Performance Compared
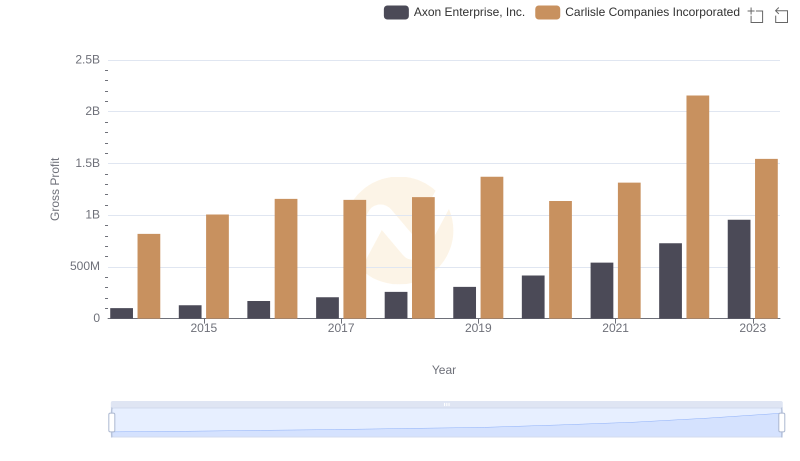
Gross Profit Trends Compared: Axon Enterprise, Inc. vs Carlisle Companies Incorporated
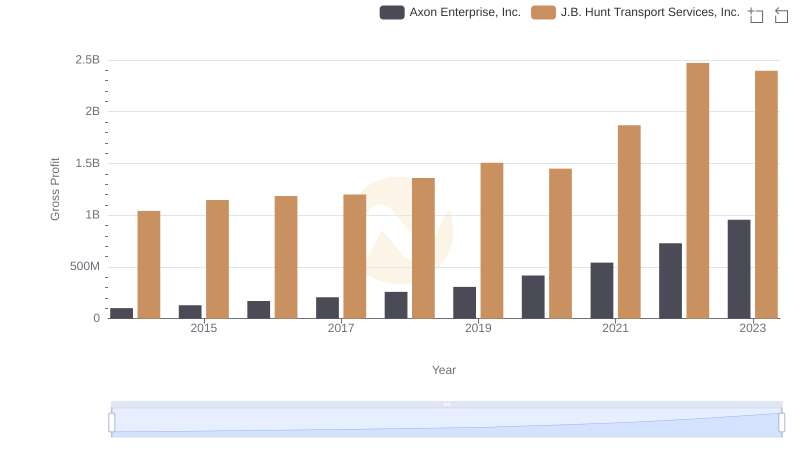
Gross Profit Comparison: Axon Enterprise, Inc. and J.B. Hunt Transport Services, Inc. Trends
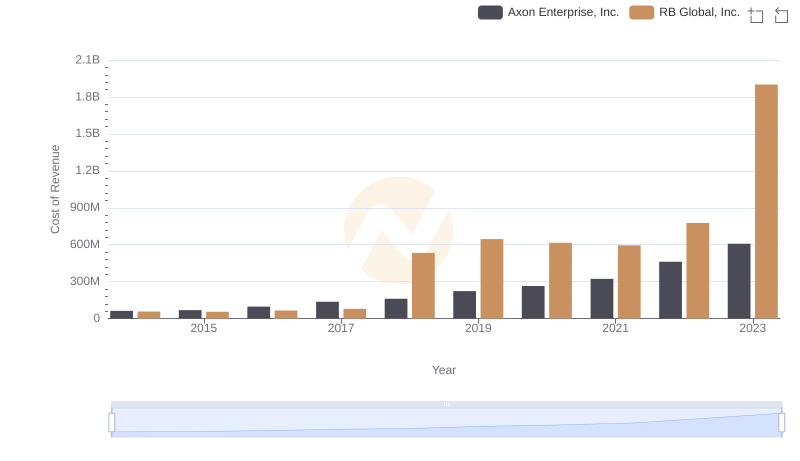
Cost Insights: Breaking Down Axon Enterprise, Inc. and RB Global, Inc.'s Expenses
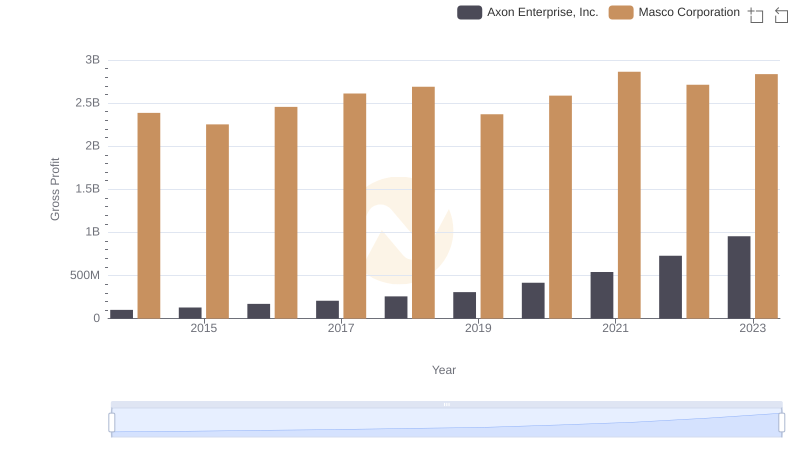
Axon Enterprise, Inc. and Masco Corporation: A Detailed Gross Profit Analysis
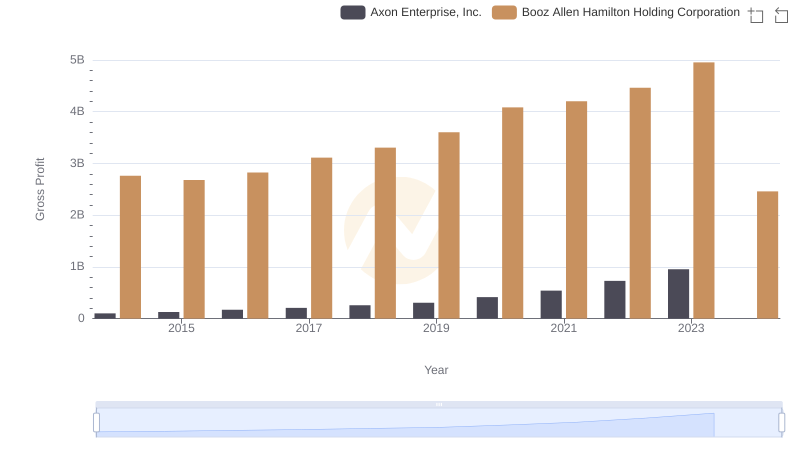
Axon Enterprise, Inc. and Booz Allen Hamilton Holding Corporation: A Detailed Gross Profit Analysis
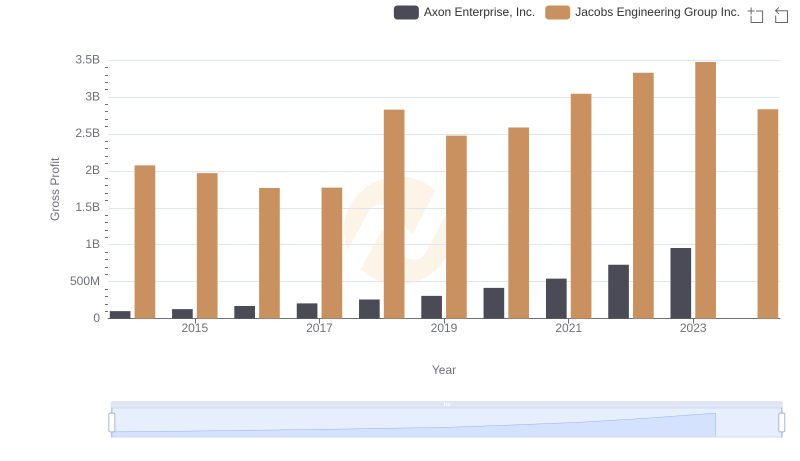
Axon Enterprise, Inc. vs Jacobs Engineering Group Inc.: A Gross Profit Performance Breakdown
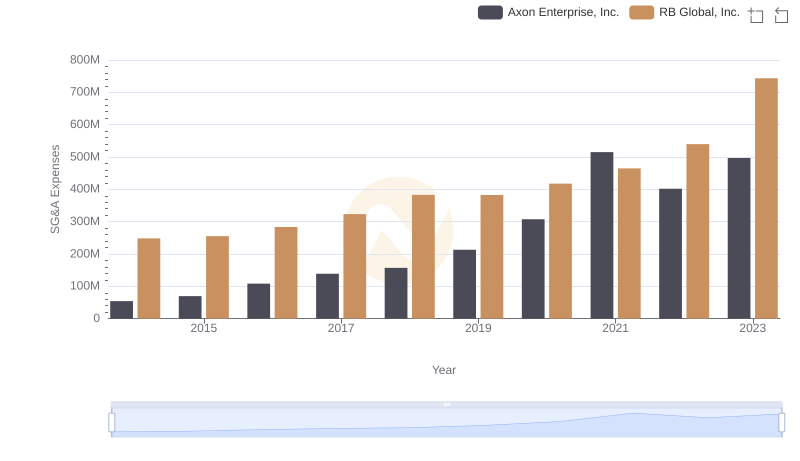
Axon Enterprise, Inc. vs RB Global, Inc.: SG&A Expense Trends
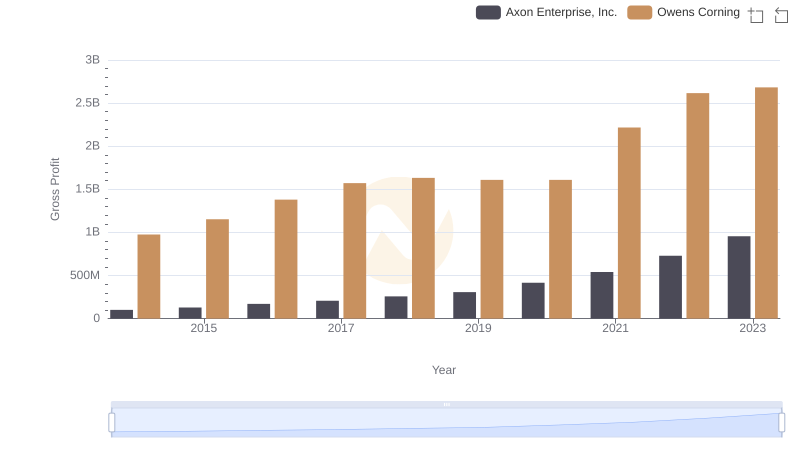
Gross Profit Analysis: Comparing Axon Enterprise, Inc. and Owens Corning
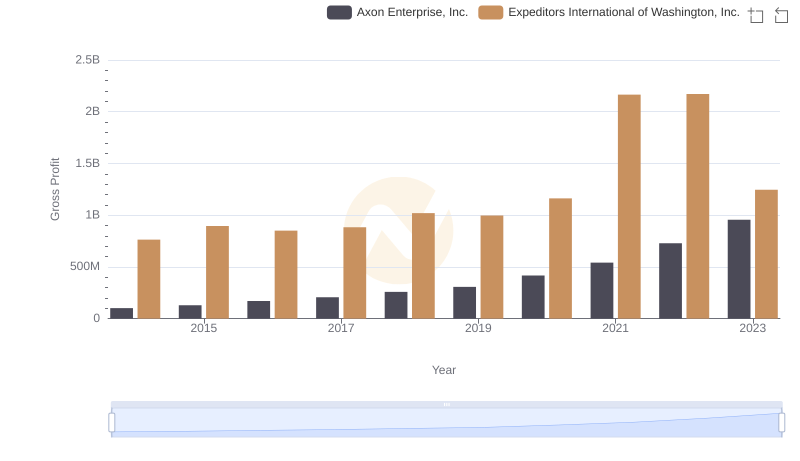
Who Generates Higher Gross Profit? Axon Enterprise, Inc. or Expeditors International of Washington, Inc.