| __timestamp | Axon Enterprise, Inc. | Carlisle Companies Incorporated |
|---|---|---|
| Wednesday, January 1, 2014 | 101548000 | 819500000 |
| Thursday, January 1, 2015 | 128647000 | 1006700000 |
| Friday, January 1, 2016 | 170536000 | 1157300000 |
| Sunday, January 1, 2017 | 207088000 | 1148000000 |
| Monday, January 1, 2018 | 258583000 | 1174700000 |
| Tuesday, January 1, 2019 | 307286000 | 1371700000 |
| Wednesday, January 1, 2020 | 416331000 | 1137400000 |
| Friday, January 1, 2021 | 540910000 | 1314700000 |
| Saturday, January 1, 2022 | 728638000 | 2157400000 |
| Sunday, January 1, 2023 | 955382000 | 1544000000 |
| Monday, January 1, 2024 | 1887700000 |
Infusing magic into the data realm
In the ever-evolving landscape of American industry, the financial trajectories of Axon Enterprise, Inc. and Carlisle Companies Incorporated offer a fascinating glimpse into the dynamics of growth and resilience. Over the past decade, from 2014 to 2023, Axon Enterprise has demonstrated a remarkable upward trend in gross profit, surging by approximately 840%, from $101 million to $955 million. This growth reflects Axon's strategic innovations in public safety technology.
Conversely, Carlisle Companies, a diversified manufacturer, experienced a more modest 88% increase in gross profit, peaking at $2.16 billion in 2022 before settling at $1.54 billion in 2023. This fluctuation underscores the challenges faced by traditional manufacturing sectors amidst global economic shifts.
These trends highlight the contrasting paths of a tech-driven enterprise and a manufacturing stalwart, offering valuable insights for investors and industry analysts alike.
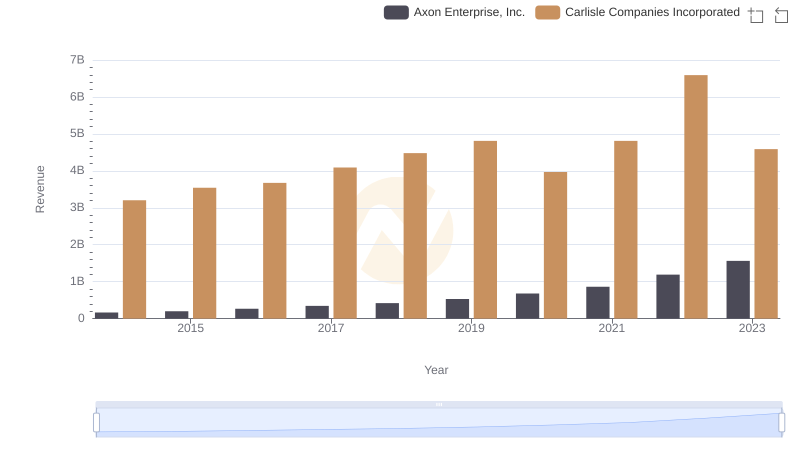
Axon Enterprise, Inc. and Carlisle Companies Incorporated: A Comprehensive Revenue Analysis
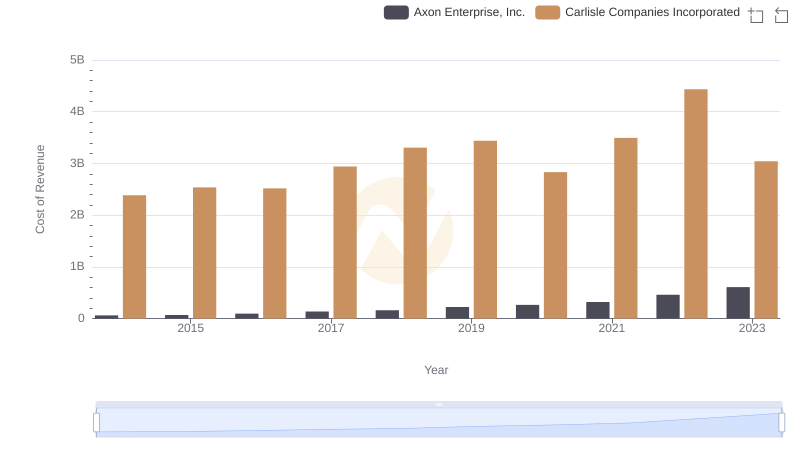
Cost Insights: Breaking Down Axon Enterprise, Inc. and Carlisle Companies Incorporated's Expenses
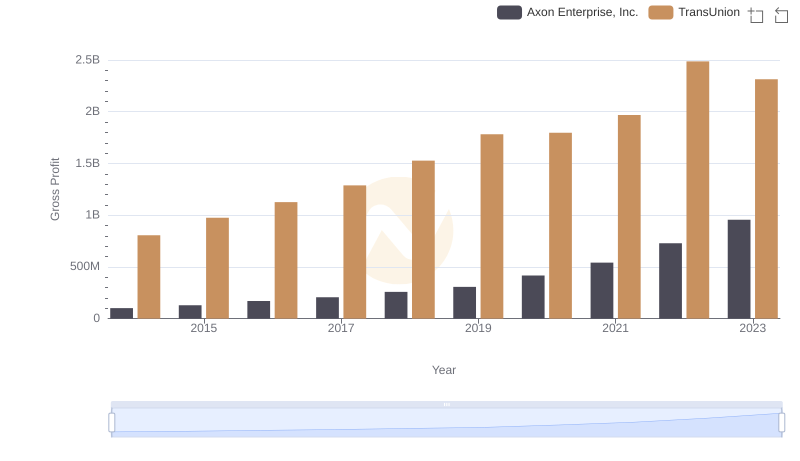
Gross Profit Comparison: Axon Enterprise, Inc. and TransUnion Trends
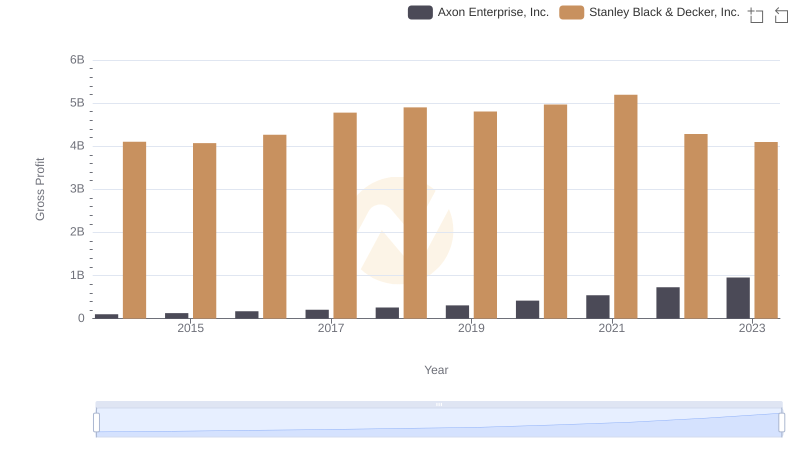
Axon Enterprise, Inc. and Stanley Black & Decker, Inc.: A Detailed Gross Profit Analysis
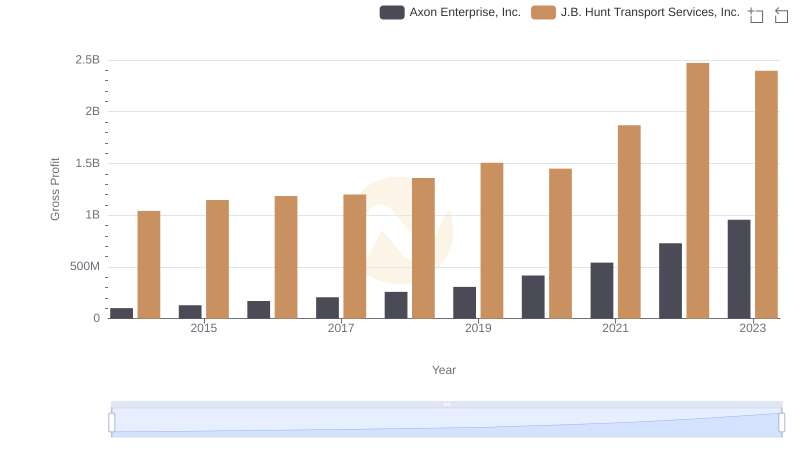
Gross Profit Comparison: Axon Enterprise, Inc. and J.B. Hunt Transport Services, Inc. Trends
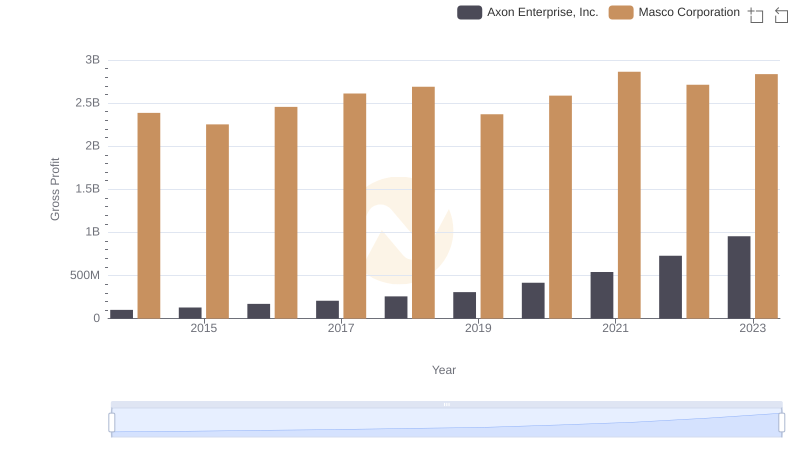
Axon Enterprise, Inc. and Masco Corporation: A Detailed Gross Profit Analysis
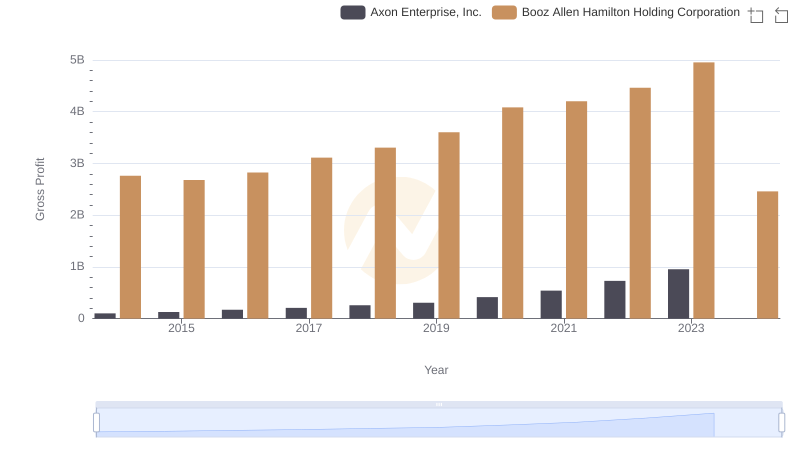
Axon Enterprise, Inc. and Booz Allen Hamilton Holding Corporation: A Detailed Gross Profit Analysis
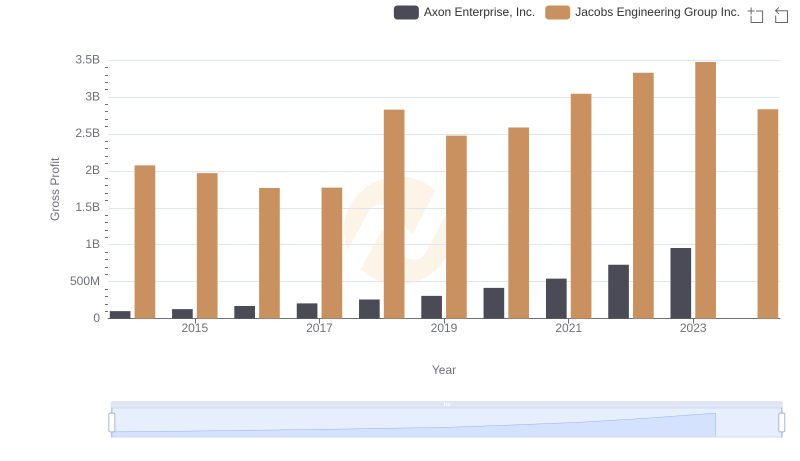
Axon Enterprise, Inc. vs Jacobs Engineering Group Inc.: A Gross Profit Performance Breakdown
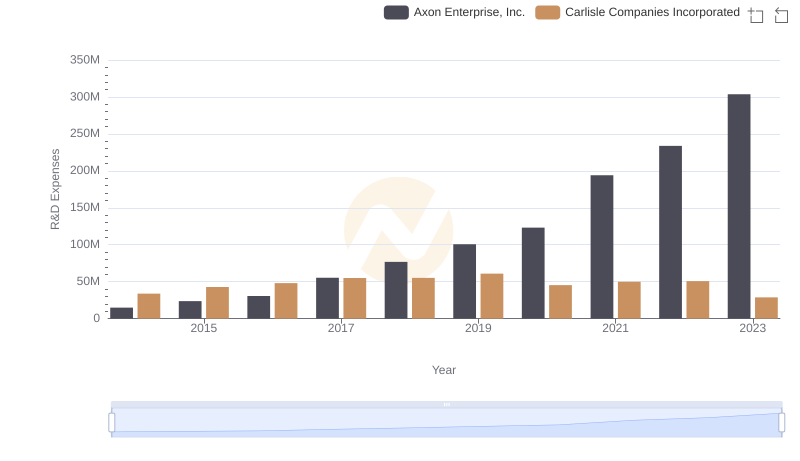
Analyzing R&D Budgets: Axon Enterprise, Inc. vs Carlisle Companies Incorporated
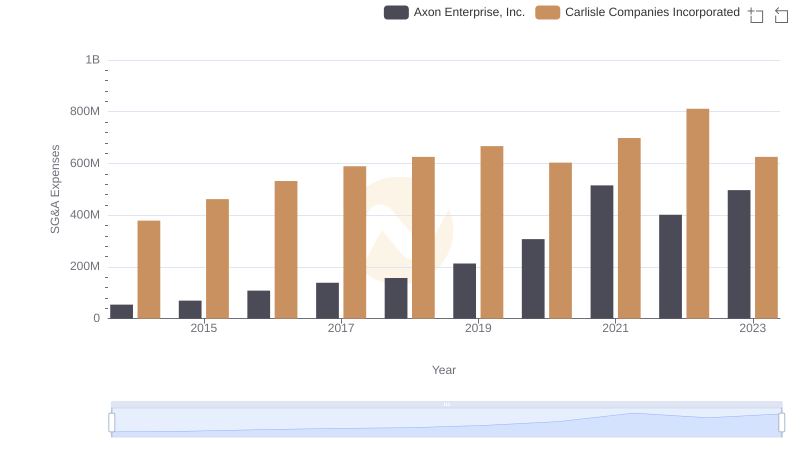
Breaking Down SG&A Expenses: Axon Enterprise, Inc. vs Carlisle Companies Incorporated