| __timestamp | Owens Corning | United Rentals, Inc. |
|---|---|---|
| Wednesday, January 1, 2014 | 650000000 | 1678000000 |
| Thursday, January 1, 2015 | 853000000 | 2653000000 |
| Friday, January 1, 2016 | 1041000000 | 2566000000 |
| Sunday, January 1, 2017 | 1134000000 | 2843000000 |
| Monday, January 1, 2018 | 1266000000 | 3628000000 |
| Tuesday, January 1, 2019 | 1178000000 | 4200000000 |
| Wednesday, January 1, 2020 | 341000000 | 2195000000 |
| Friday, January 1, 2021 | 1909000000 | 2642000000 |
| Saturday, January 1, 2022 | 2200000000 | 5464000000 |
| Sunday, January 1, 2023 | 2166000000 | 6627000000 |
| Monday, January 1, 2024 | 4516000000 |
Infusing magic into the data realm
In the ever-evolving landscape of industrial giants, United Rentals, Inc. and Owens Corning have carved distinct paths in the financial realm. Over the past decade, United Rentals has consistently outperformed Owens Corning in EBITDA, showcasing a robust growth trajectory. From 2014 to 2023, United Rentals' EBITDA surged by nearly 295%, peaking at an impressive $6.6 billion in 2023. In contrast, Owens Corning experienced a more modest growth of approximately 233%, reaching $2.2 billion in the same year.
The year 2020 marked a significant dip for both companies, with Owens Corning's EBITDA plummeting to $341 million, while United Rentals saw a decline to $2.2 billion. However, both companies rebounded strongly in subsequent years. Notably, data for 2024 is incomplete, leaving room for speculation on future trends. This comparison highlights the dynamic nature of industrial performance and the resilience of these market leaders.
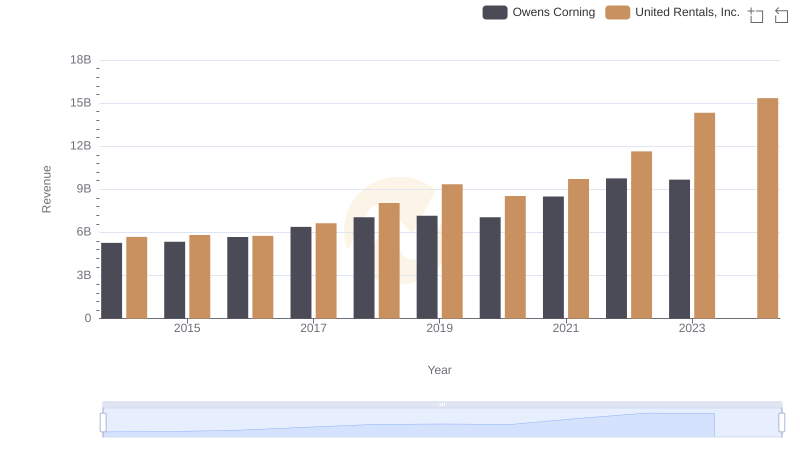
United Rentals, Inc. vs Owens Corning: Annual Revenue Growth Compared
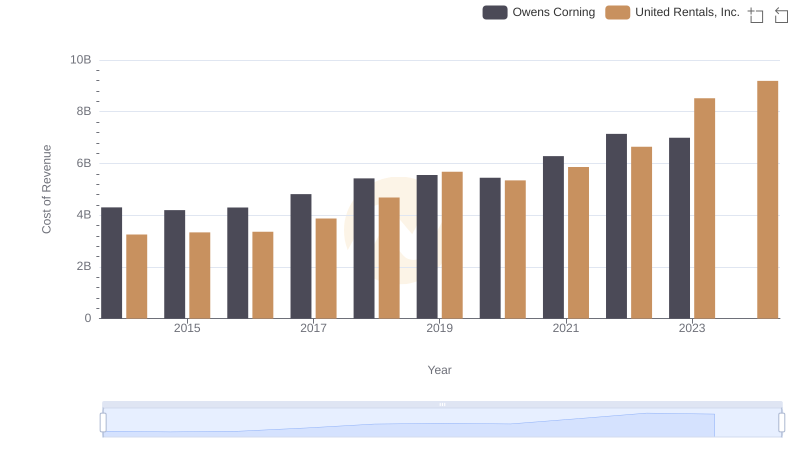
Analyzing Cost of Revenue: United Rentals, Inc. and Owens Corning
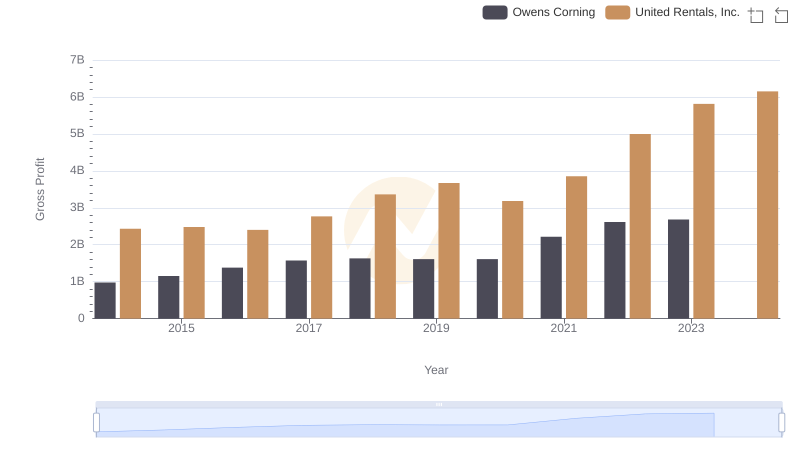
United Rentals, Inc. and Owens Corning: A Detailed Gross Profit Analysis
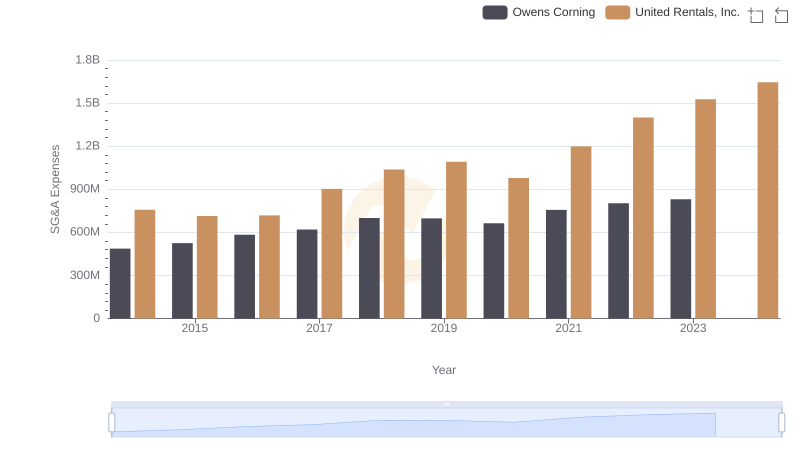
Breaking Down SG&A Expenses: United Rentals, Inc. vs Owens Corning
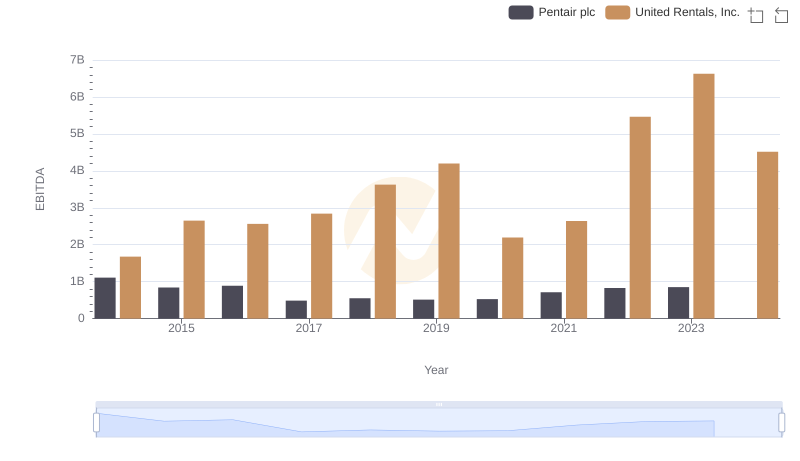
Comprehensive EBITDA Comparison: United Rentals, Inc. vs Pentair plc

Comparative EBITDA Analysis: United Rentals, Inc. vs IDEX Corporation
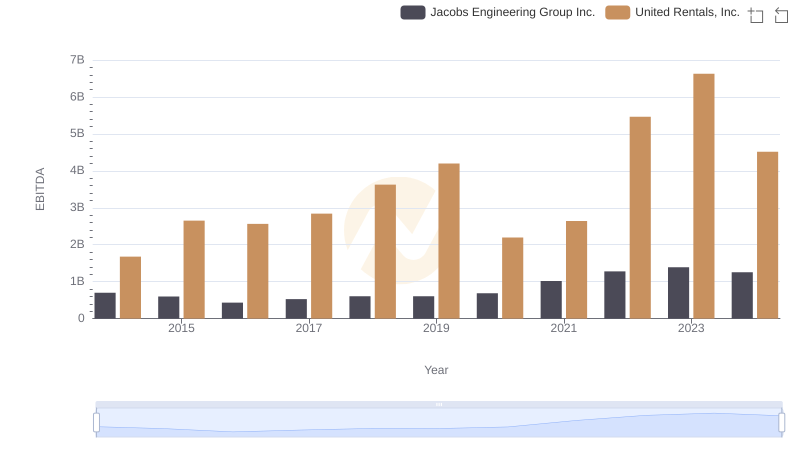
EBITDA Performance Review: United Rentals, Inc. vs Jacobs Engineering Group Inc.
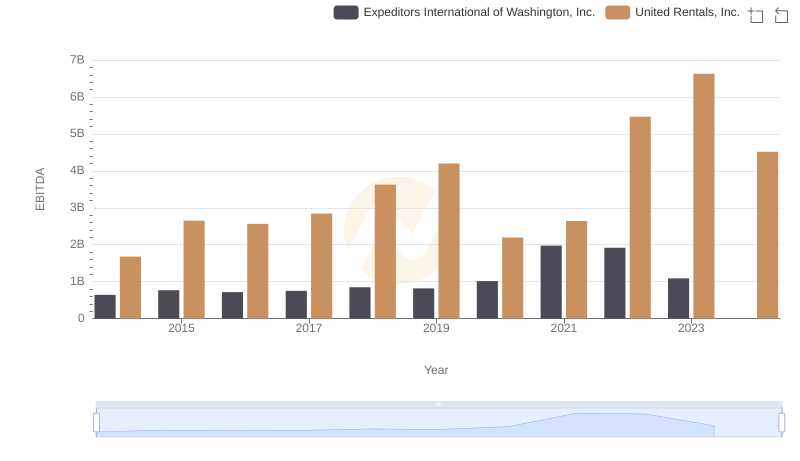
A Side-by-Side Analysis of EBITDA: United Rentals, Inc. and Expeditors International of Washington, Inc.
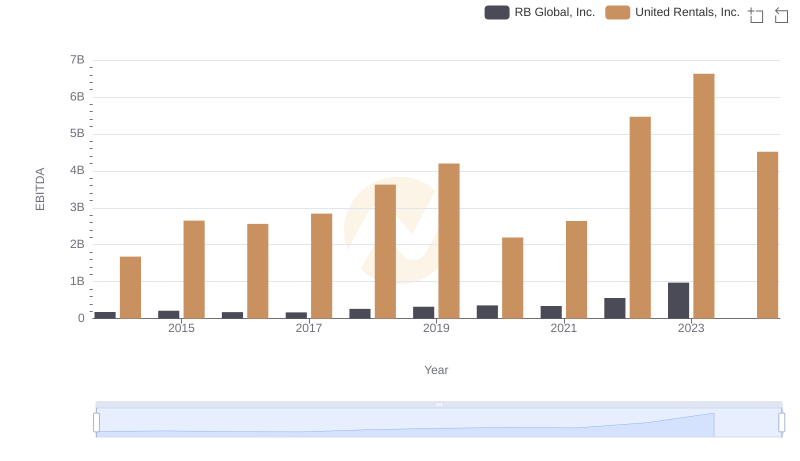
Comprehensive EBITDA Comparison: United Rentals, Inc. vs RB Global, Inc.
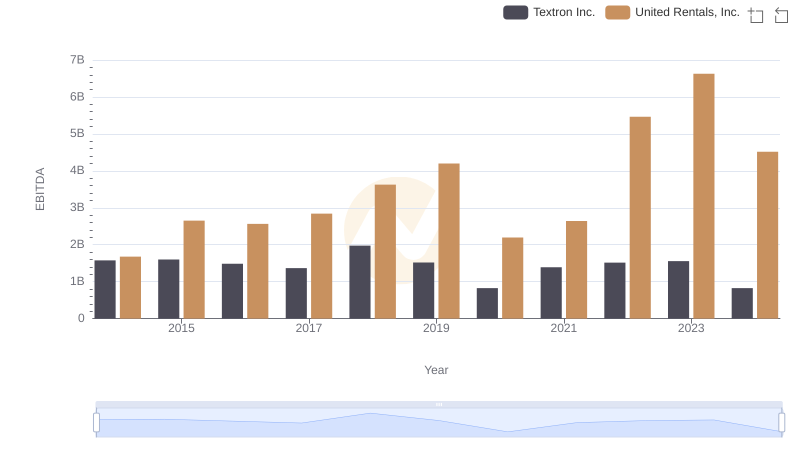
United Rentals, Inc. vs Textron Inc.: In-Depth EBITDA Performance Comparison
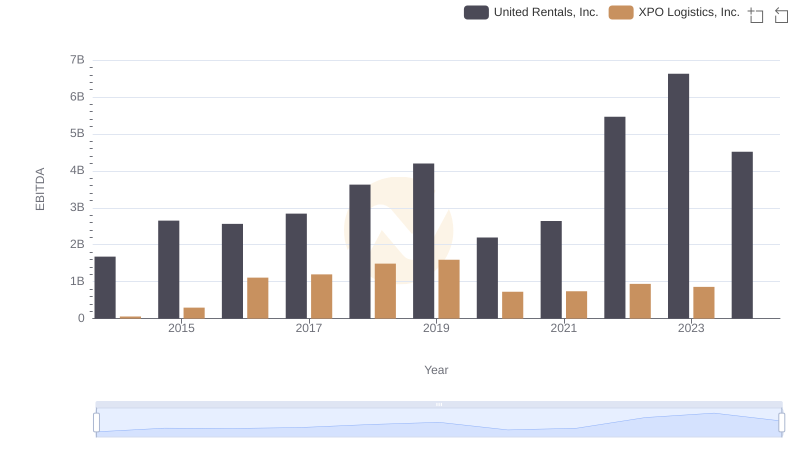
EBITDA Performance Review: United Rentals, Inc. vs XPO Logistics, Inc.