| __timestamp | Expeditors International of Washington, Inc. | United Rentals, Inc. |
|---|---|---|
| Wednesday, January 1, 2014 | 643940000 | 1678000000 |
| Thursday, January 1, 2015 | 767496000 | 2653000000 |
| Friday, January 1, 2016 | 716959000 | 2566000000 |
| Sunday, January 1, 2017 | 749570000 | 2843000000 |
| Monday, January 1, 2018 | 850582000 | 3628000000 |
| Tuesday, January 1, 2019 | 817642000 | 4200000000 |
| Wednesday, January 1, 2020 | 1013523000 | 2195000000 |
| Friday, January 1, 2021 | 1975928000 | 2642000000 |
| Saturday, January 1, 2022 | 1916506000 | 5464000000 |
| Sunday, January 1, 2023 | 1087588000 | 6627000000 |
| Monday, January 1, 2024 | 1154330000 | 4516000000 |
Igniting the spark of knowledge
In the ever-evolving landscape of the U.S. stock market, understanding the financial health of companies is crucial. This analysis delves into the EBITDA performance of two industry giants: United Rentals, Inc. and Expeditors International of Washington, Inc., from 2014 to 2023.
United Rentals has demonstrated a robust growth trajectory, with its EBITDA surging by nearly 295% over the decade, peaking at approximately $6.6 billion in 2023. This growth underscores its strategic expansions and operational efficiencies. In contrast, Expeditors International, a leader in logistics, experienced a more modest 69% increase, reaching its highest EBITDA of around $1.98 billion in 2021.
While United Rentals capitalized on market opportunities, Expeditors faced challenges, reflected in its fluctuating EBITDA. Notably, data for 2024 is incomplete, highlighting the need for ongoing analysis to capture future trends.
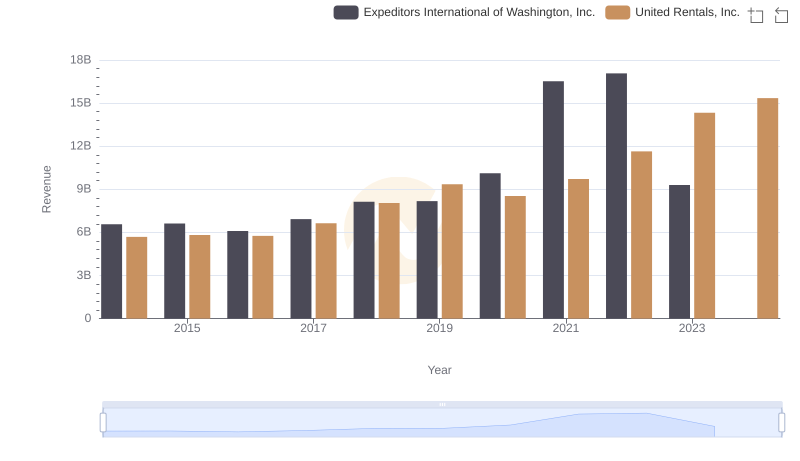
Comparing Revenue Performance: United Rentals, Inc. or Expeditors International of Washington, Inc.?

Cost of Revenue: Key Insights for United Rentals, Inc. and Expeditors International of Washington, Inc.
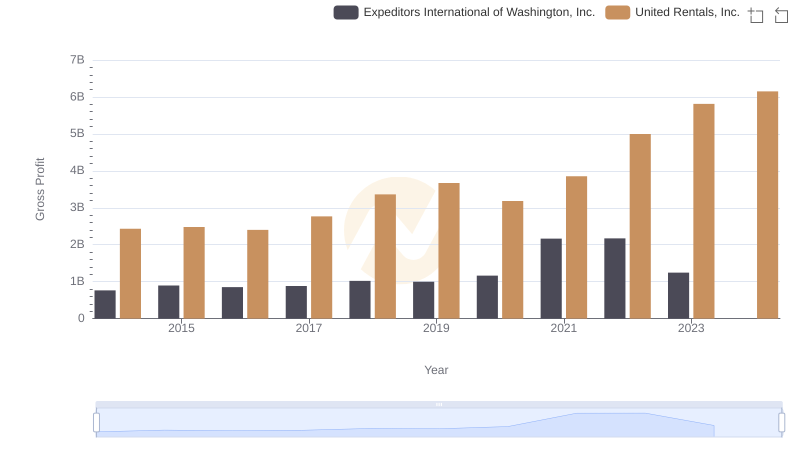
United Rentals, Inc. vs Expeditors International of Washington, Inc.: A Gross Profit Performance Breakdown
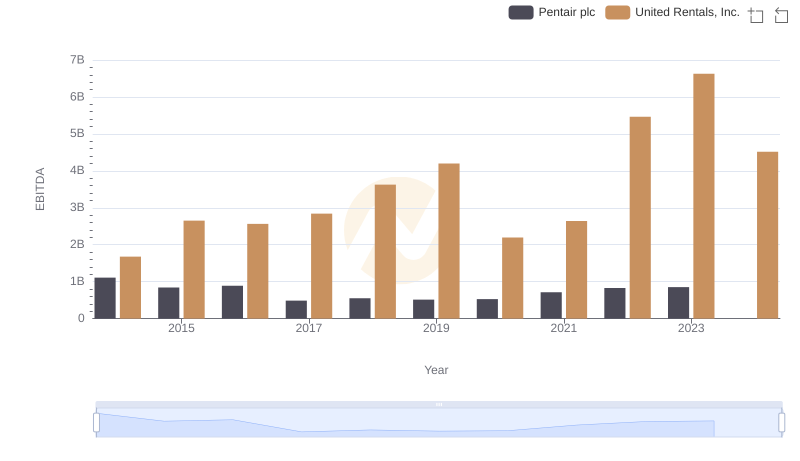
Comprehensive EBITDA Comparison: United Rentals, Inc. vs Pentair plc

Breaking Down SG&A Expenses: United Rentals, Inc. vs Expeditors International of Washington, Inc.

Comparative EBITDA Analysis: United Rentals, Inc. vs IDEX Corporation
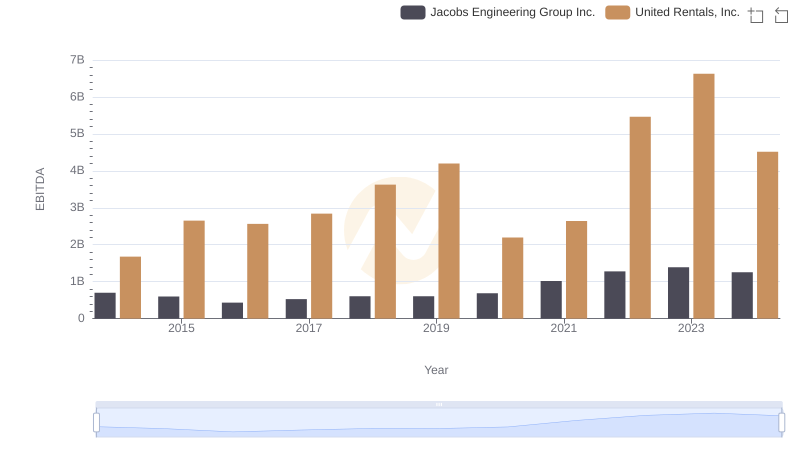
EBITDA Performance Review: United Rentals, Inc. vs Jacobs Engineering Group Inc.

United Rentals, Inc. vs Owens Corning: In-Depth EBITDA Performance Comparison
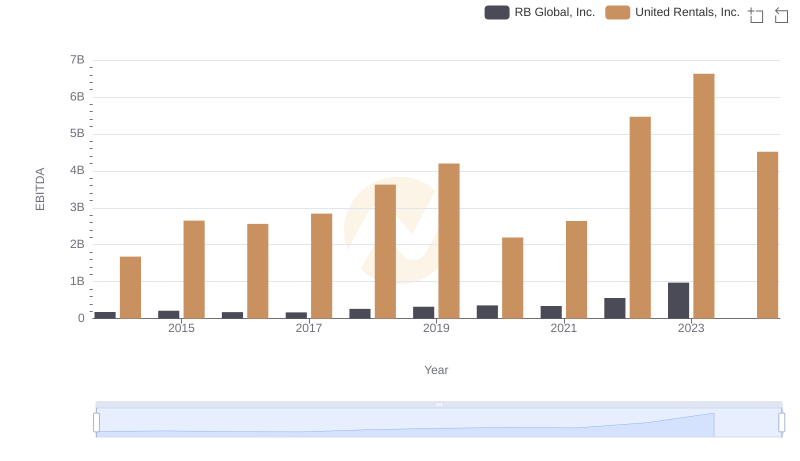
Comprehensive EBITDA Comparison: United Rentals, Inc. vs RB Global, Inc.
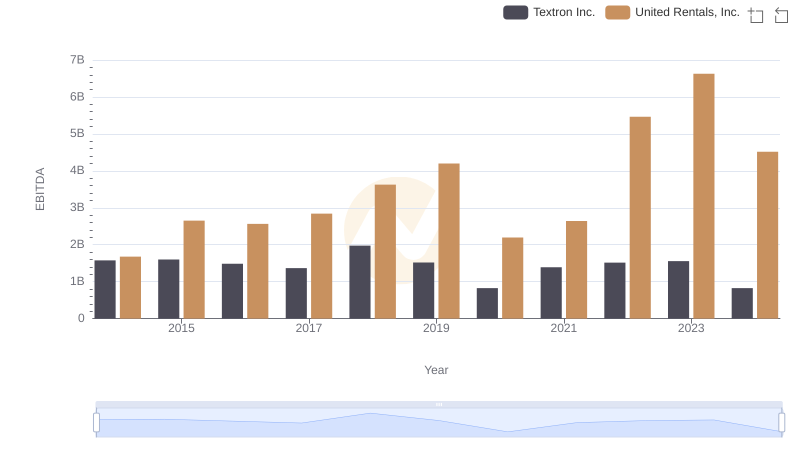
United Rentals, Inc. vs Textron Inc.: In-Depth EBITDA Performance Comparison
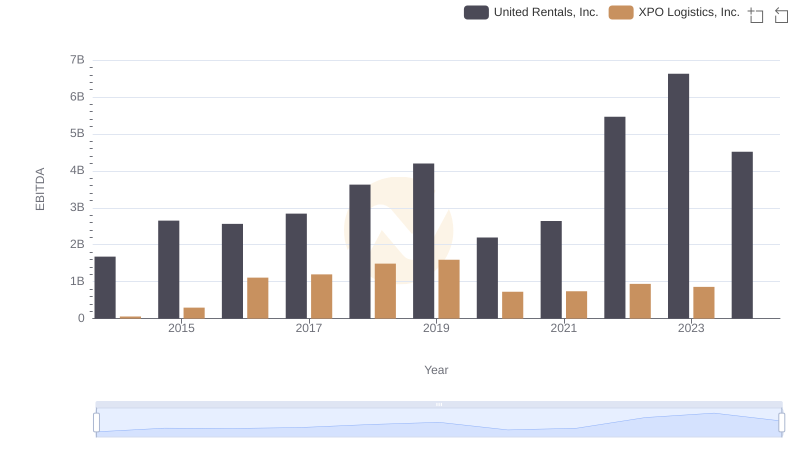
EBITDA Performance Review: United Rentals, Inc. vs XPO Logistics, Inc.