| __timestamp | Rockwell Automation, Inc. | Watsco, Inc. |
|---|---|---|
| Wednesday, January 1, 2014 | 2753900000 | 956402000 |
| Thursday, January 1, 2015 | 2703100000 | 1007357000 |
| Friday, January 1, 2016 | 2475500000 | 1034584000 |
| Sunday, January 1, 2017 | 2624200000 | 1065659000 |
| Monday, January 1, 2018 | 2872200000 | 1120252000 |
| Tuesday, January 1, 2019 | 2900100000 | 1156956000 |
| Wednesday, January 1, 2020 | 2595200000 | 1222821000 |
| Friday, January 1, 2021 | 2897700000 | 1667545000 |
| Saturday, January 1, 2022 | 3102000000 | 2030289000 |
| Sunday, January 1, 2023 | 3717000000 | 1992140000 |
| Monday, January 1, 2024 | 3193400000 | 2044713000 |
In pursuit of knowledge
In the competitive landscape of industrial automation and HVAC distribution, Rockwell Automation and Watsco have showcased distinct trajectories over the past decade. From 2014 to 2023, Rockwell Automation's gross profit surged by approximately 35%, peaking in 2023. This growth reflects its strategic innovations and market expansion. In contrast, Watsco's gross profit doubled from 2014 to 2022, highlighting its robust distribution network and increasing demand for HVAC solutions. However, 2023 saw a slight dip, indicating potential market challenges or strategic shifts. Notably, data for 2024 is incomplete, suggesting ongoing developments. This analysis underscores the dynamic nature of these industries and the companies' adaptive strategies. As we look forward, stakeholders should watch for emerging trends and strategic pivots that could redefine these giants' market positions.
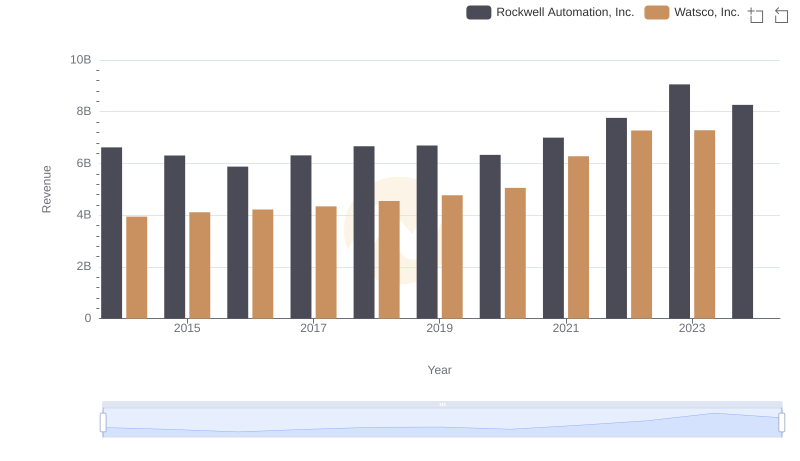
Annual Revenue Comparison: Rockwell Automation, Inc. vs Watsco, Inc.
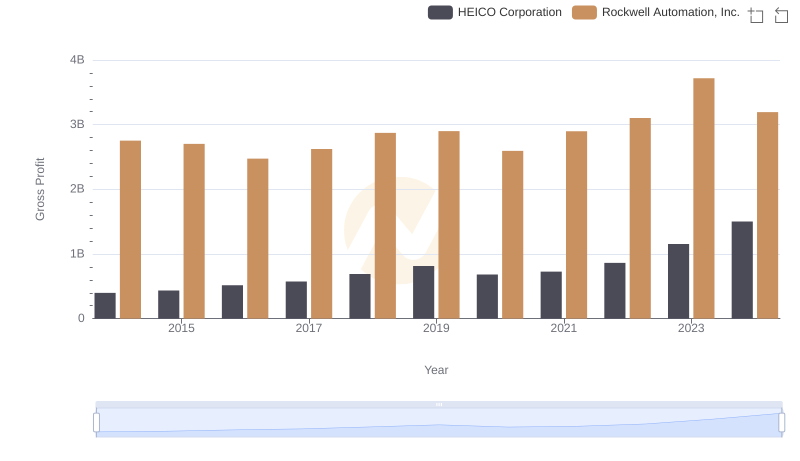
Gross Profit Analysis: Comparing Rockwell Automation, Inc. and HEICO Corporation
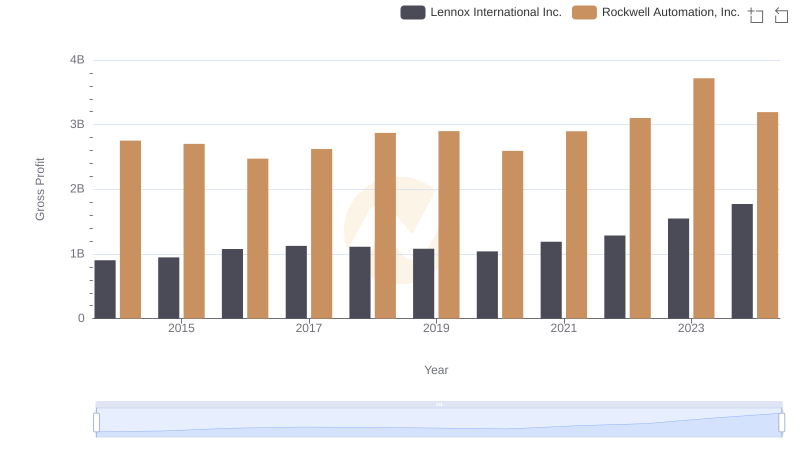
Rockwell Automation, Inc. vs Lennox International Inc.: A Gross Profit Performance Breakdown

Key Insights on Gross Profit: Rockwell Automation, Inc. vs Hubbell Incorporated
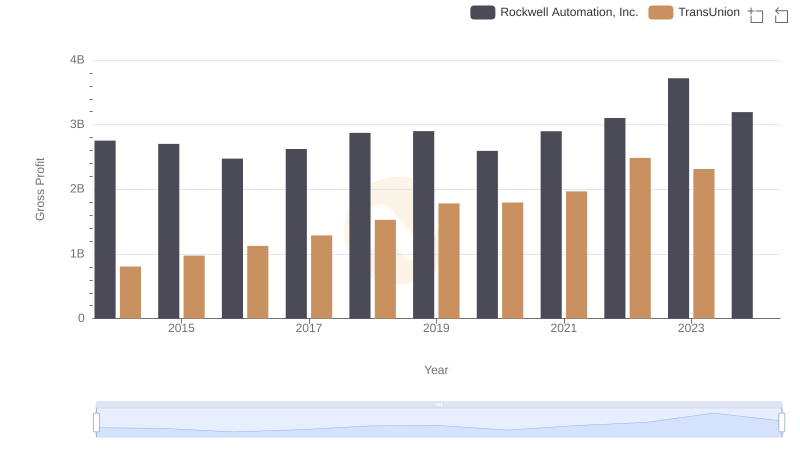
Rockwell Automation, Inc. and TransUnion: A Detailed Gross Profit Analysis
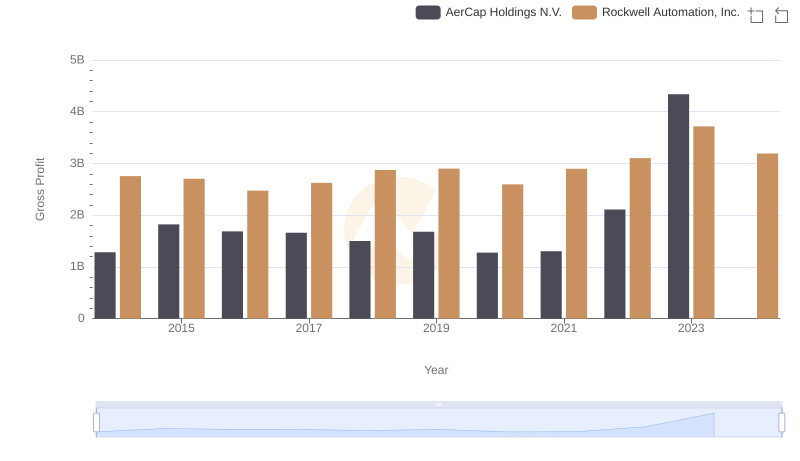
Gross Profit Comparison: Rockwell Automation, Inc. and AerCap Holdings N.V. Trends
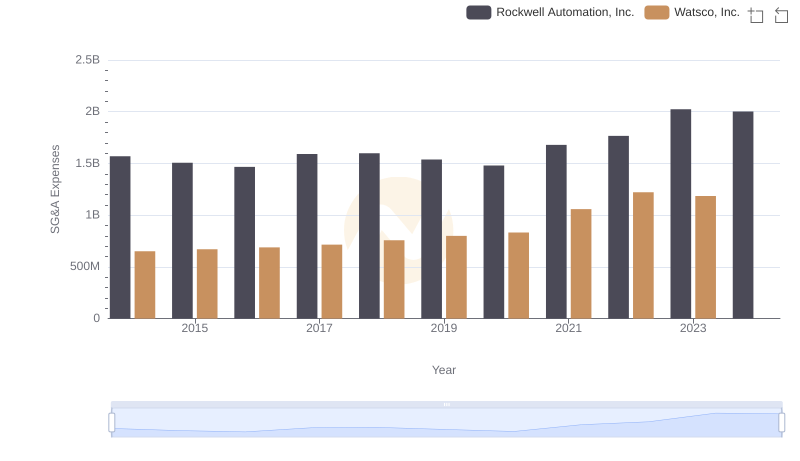
Operational Costs Compared: SG&A Analysis of Rockwell Automation, Inc. and Watsco, Inc.
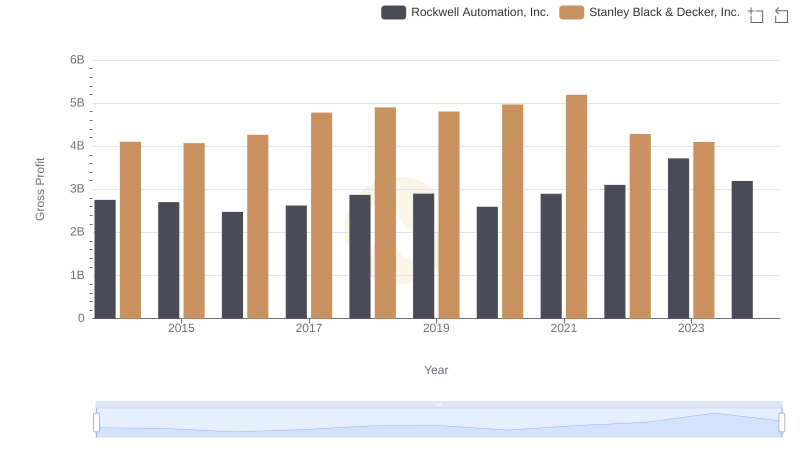
Who Generates Higher Gross Profit? Rockwell Automation, Inc. or Stanley Black & Decker, Inc.
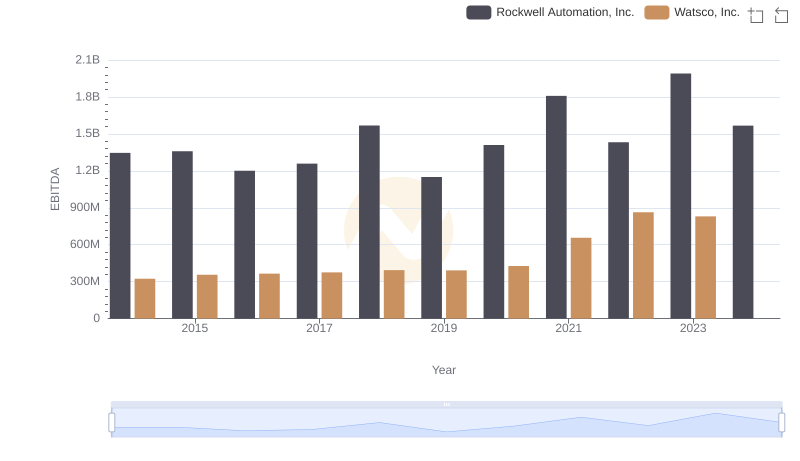
Comprehensive EBITDA Comparison: Rockwell Automation, Inc. vs Watsco, Inc.