| __timestamp | Lennox International Inc. | Masco Corporation |
|---|---|---|
| Wednesday, January 1, 2014 | 2464100000 | 6134000000 |
| Thursday, January 1, 2015 | 2520000000 | 4889000000 |
| Friday, January 1, 2016 | 2565100000 | 4901000000 |
| Sunday, January 1, 2017 | 2714400000 | 5033000000 |
| Monday, January 1, 2018 | 2772700000 | 5670000000 |
| Tuesday, January 1, 2019 | 2727400000 | 4336000000 |
| Wednesday, January 1, 2020 | 2594000000 | 4601000000 |
| Friday, January 1, 2021 | 3005700000 | 5512000000 |
| Saturday, January 1, 2022 | 3433700000 | 5967000000 |
| Sunday, January 1, 2023 | 3434100000 | 5131000000 |
| Monday, January 1, 2024 | 3569400000 | 4997000000 |
In pursuit of knowledge
In the competitive landscape of the HVAC and home improvement sectors, Lennox International Inc. and Masco Corporation have shown distinct trends in their cost of revenue over the past decade. From 2014 to 2023, Lennox International Inc. has seen a steady increase in its cost of revenue, rising approximately 45% from 2014 to 2023. This upward trend reflects the company's expanding operations and market reach. In contrast, Masco Corporation experienced fluctuations, with a notable dip in 2019, where costs fell by about 29% compared to 2014. However, by 2022, Masco's costs had rebounded, nearing their 2014 levels. The data for 2024 is incomplete, highlighting the dynamic nature of these industries. As these companies navigate economic challenges and opportunities, their cost management strategies will be crucial in maintaining profitability and market leadership.
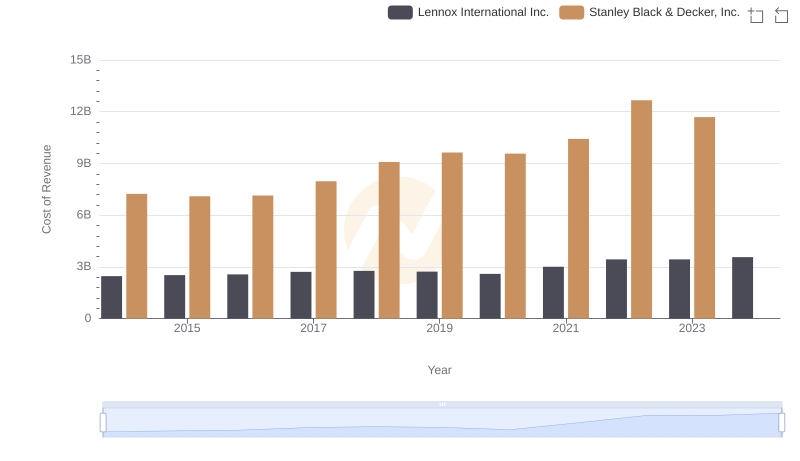
Lennox International Inc. vs Stanley Black & Decker, Inc.: Efficiency in Cost of Revenue Explored
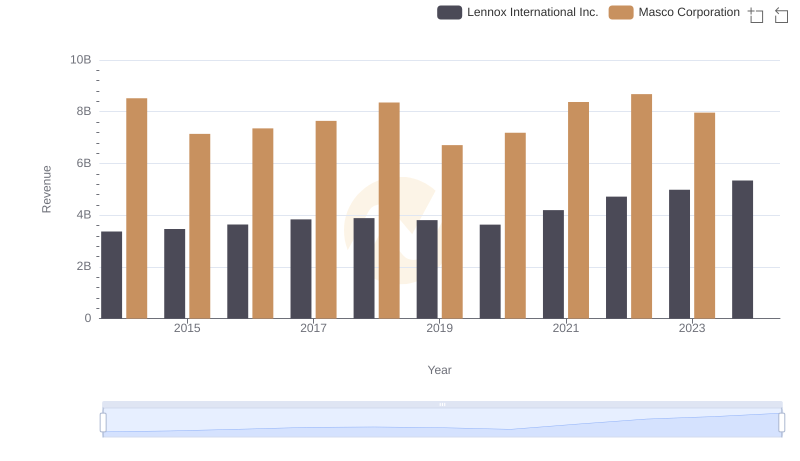
Lennox International Inc. vs Masco Corporation: Annual Revenue Growth Compared
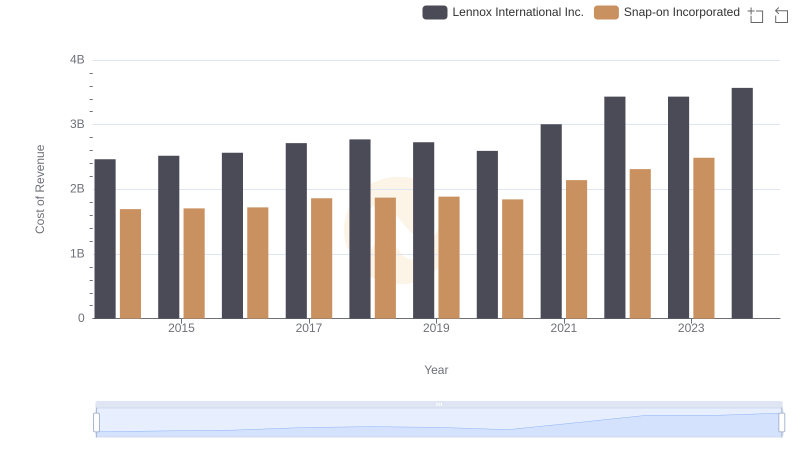
Cost Insights: Breaking Down Lennox International Inc. and Snap-on Incorporated's Expenses
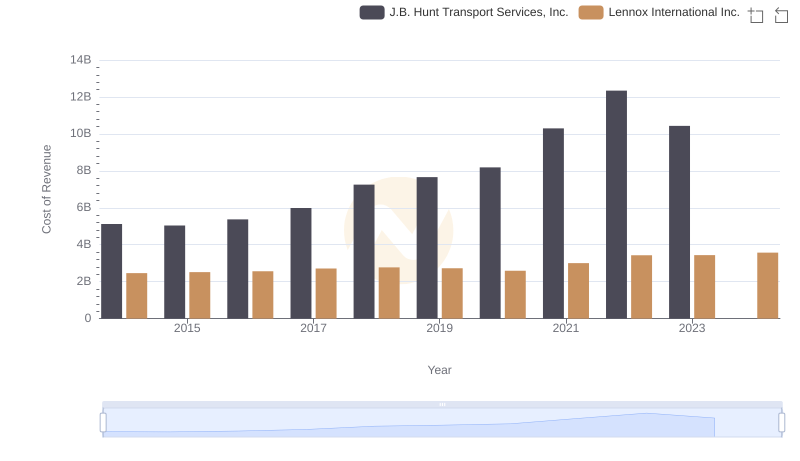
Comparing Cost of Revenue Efficiency: Lennox International Inc. vs J.B. Hunt Transport Services, Inc.
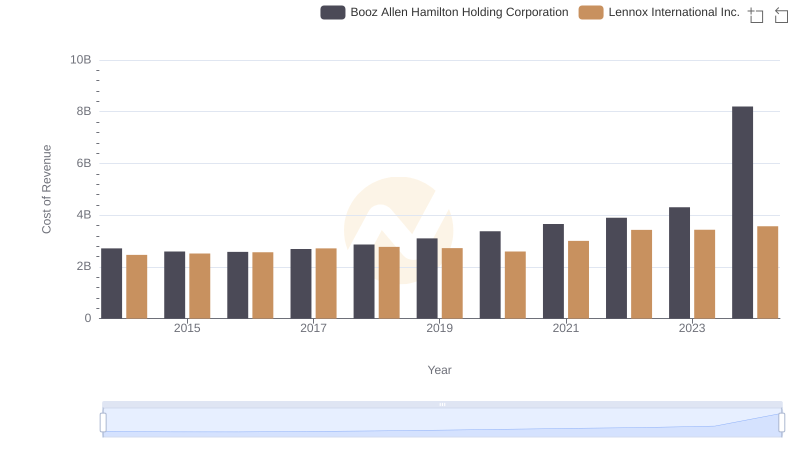
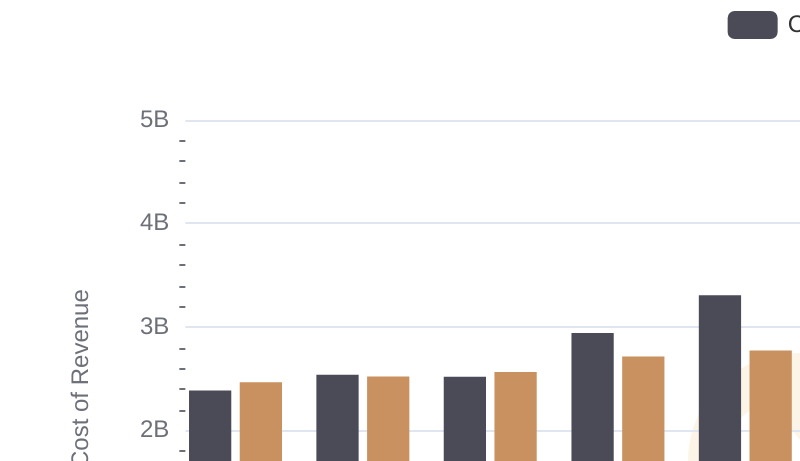
Analyzing Cost of Revenue: Lennox International Inc. and Booz Allen Hamilton Holding Corporation
Comparing Cost of Revenue Efficiency: Lennox International Inc. vs Carlisle Companies Incorporated
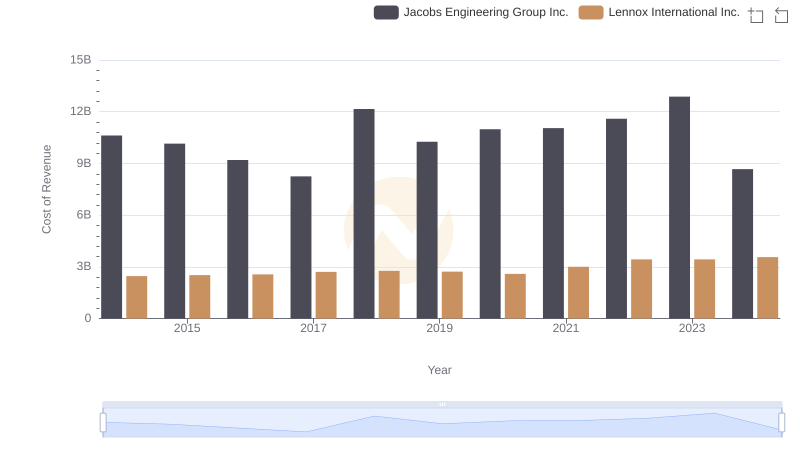
Cost of Revenue Trends: Lennox International Inc. vs Jacobs Engineering Group Inc.
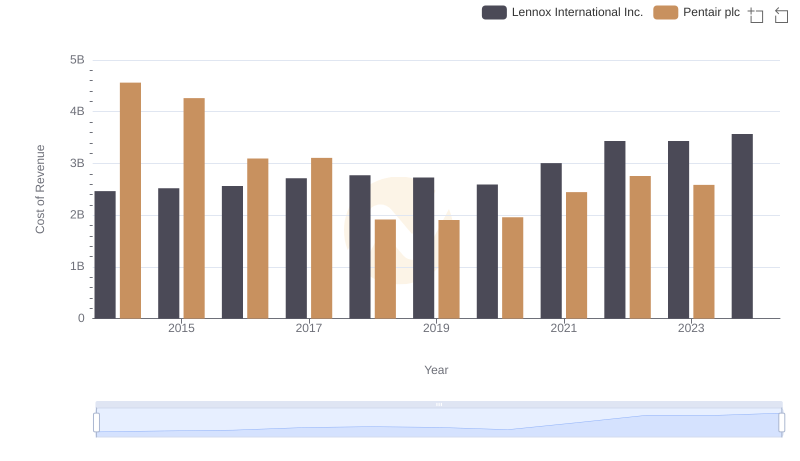
Cost Insights: Breaking Down Lennox International Inc. and Pentair plc's Expenses
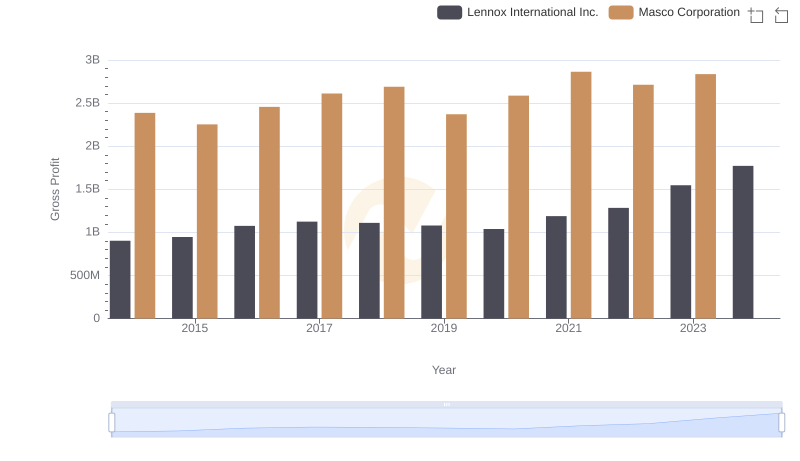
Gross Profit Trends Compared: Lennox International Inc. vs Masco Corporation
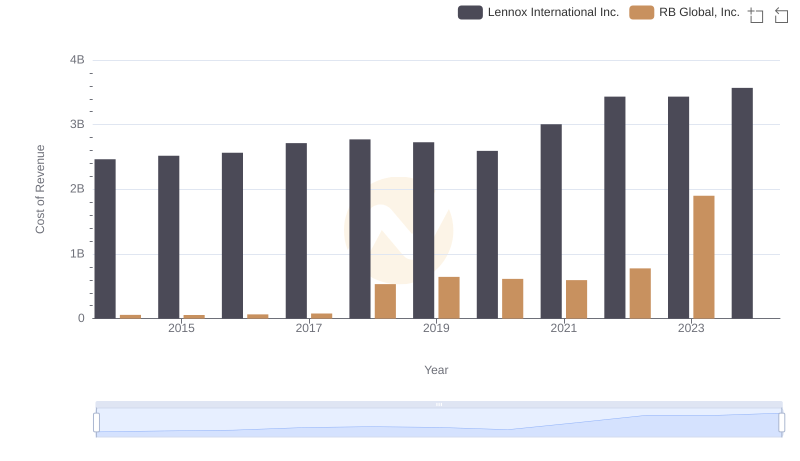
Cost of Revenue Comparison: Lennox International Inc. vs RB Global, Inc.
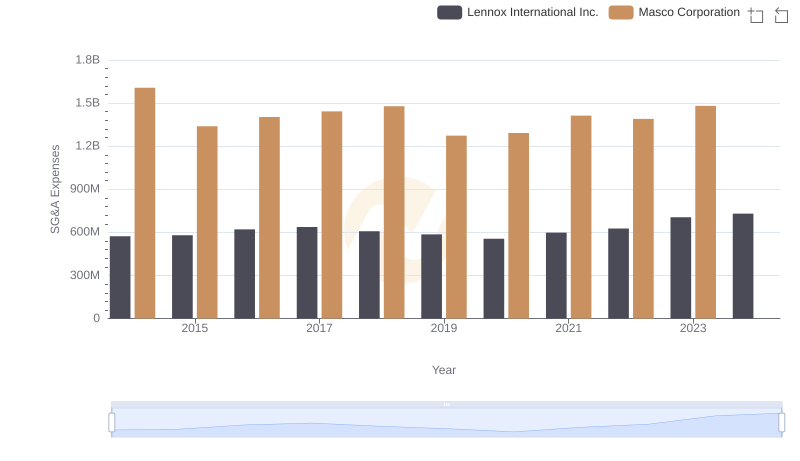
Lennox International Inc. or Masco Corporation: Who Manages SG&A Costs Better?
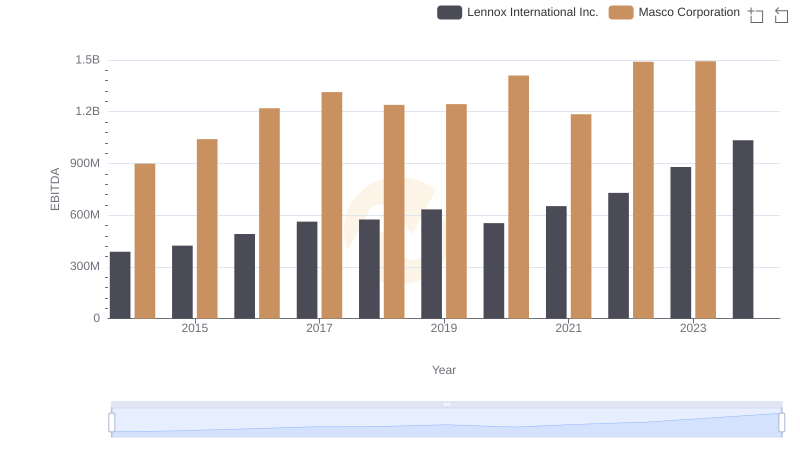
Comprehensive EBITDA Comparison: Lennox International Inc. vs Masco Corporation