| __timestamp | Trane Technologies plc | Waste Management, Inc. |
|---|---|---|
| Wednesday, January 1, 2014 | 2503900000 | 1481000000 |
| Thursday, January 1, 2015 | 2541100000 | 1343000000 |
| Friday, January 1, 2016 | 2606500000 | 1410000000 |
| Sunday, January 1, 2017 | 2720700000 | 1468000000 |
| Monday, January 1, 2018 | 2903200000 | 1453000000 |
| Tuesday, January 1, 2019 | 3129800000 | 1631000000 |
| Wednesday, January 1, 2020 | 2270600000 | 1728000000 |
| Friday, January 1, 2021 | 2446300000 | 1864000000 |
| Saturday, January 1, 2022 | 2545900000 | 1938000000 |
| Sunday, January 1, 2023 | 2963200000 | 1926000000 |
| Monday, January 1, 2024 | 3580400000 | 2264000000 |
Data in motion
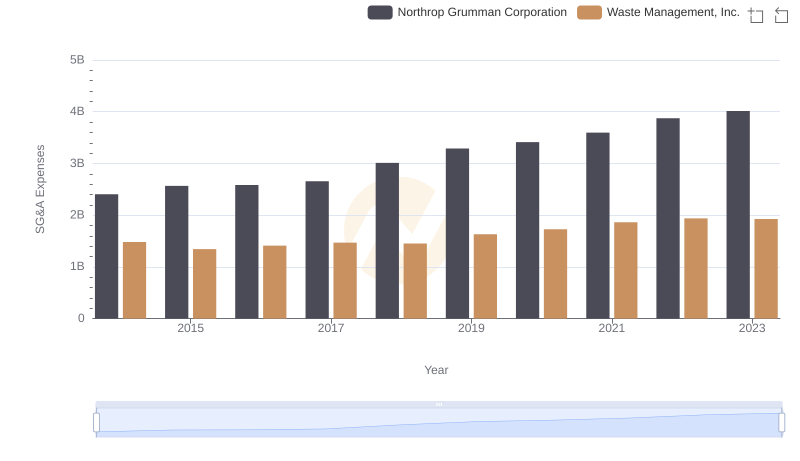
In the ever-evolving landscape of corporate finance, understanding the trends in Selling, General, and Administrative (SG&A) expenses is crucial. Over the past decade, from 2014 to 2023, Trane Technologies plc and Waste Management, Inc. have shown distinct trajectories in their SG&A expenditures. Trane Technologies has consistently outpaced Waste Management, with its expenses peaking at nearly 3 billion in 2023, marking a 19% increase from 2014. In contrast, Waste Management's SG&A expenses grew by approximately 30% over the same period, reaching close to 2 billion in 2023. This divergence highlights the differing strategic priorities and operational efficiencies of these industry giants. As companies navigate the complexities of modern business, monitoring such financial metrics offers invaluable insights into their competitive positioning and future growth potential.
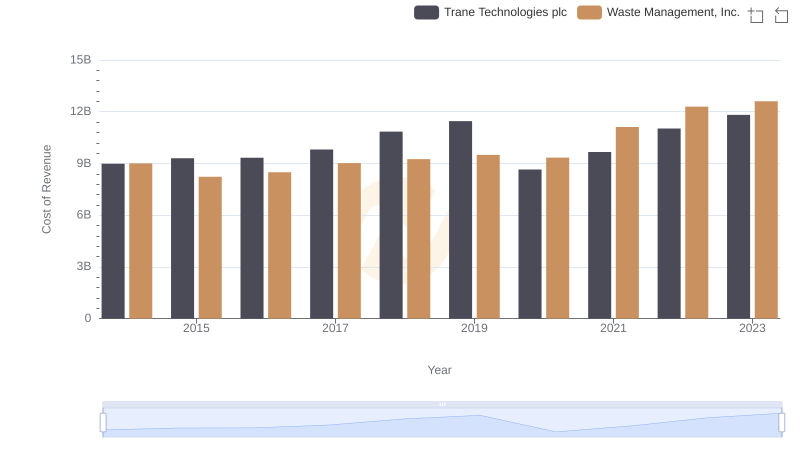
Cost of Revenue Trends: Waste Management, Inc. vs Trane Technologies plc

Gross Profit Trends Compared: Waste Management, Inc. vs Trane Technologies plc
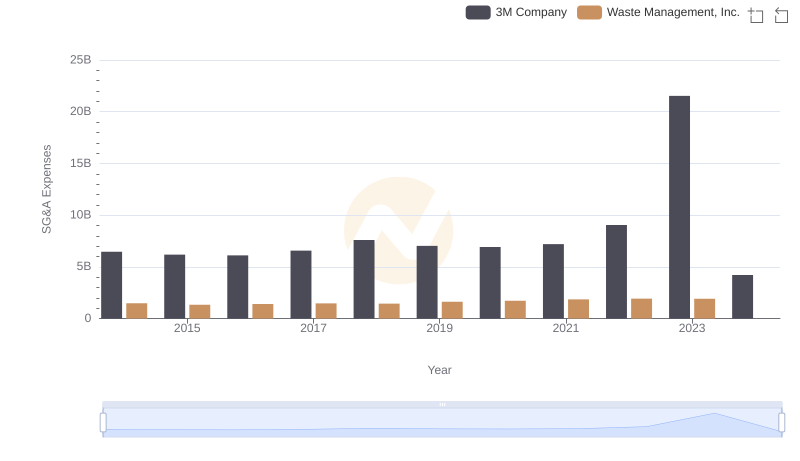
Selling, General, and Administrative Costs: Waste Management, Inc. vs 3M Company
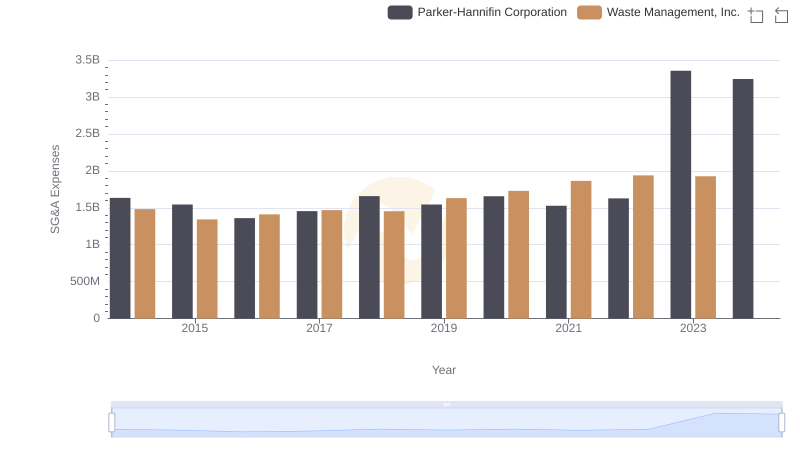
Operational Costs Compared: SG&A Analysis of Waste Management, Inc. and Parker-Hannifin Corporation
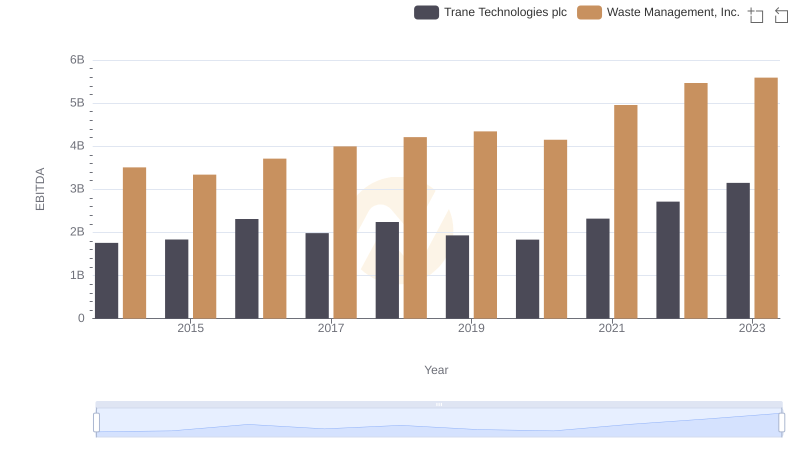
Professional EBITDA Benchmarking: Waste Management, Inc. vs Trane Technologies plc
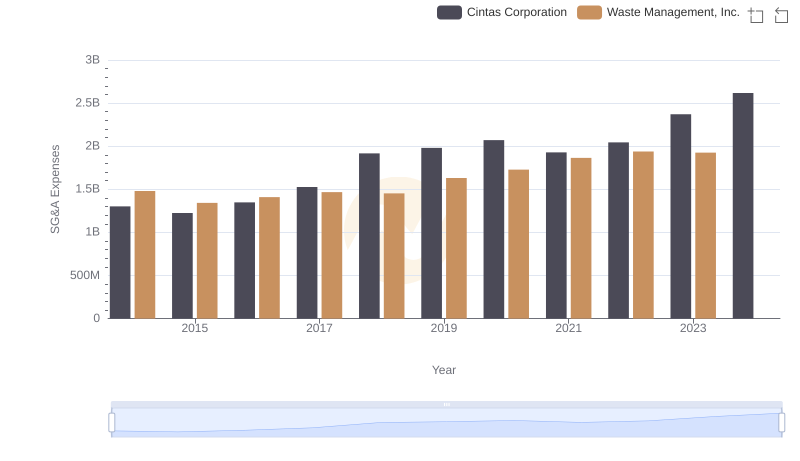
Breaking Down SG&A Expenses: Waste Management, Inc. vs Cintas Corporation
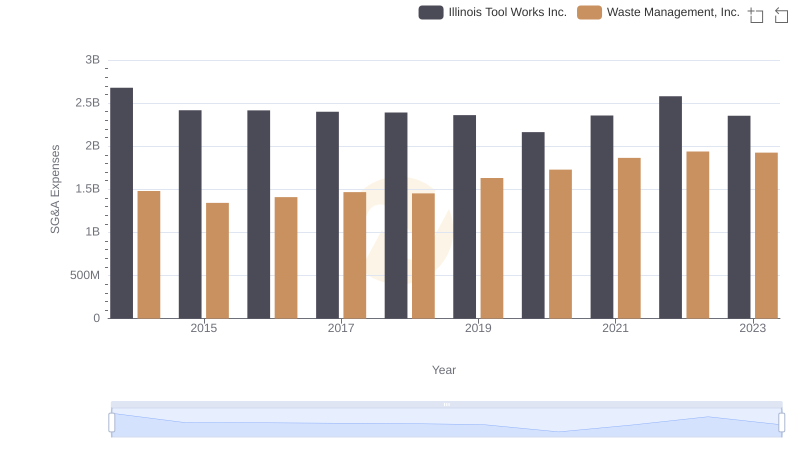
Operational Costs Compared: SG&A Analysis of Waste Management, Inc. and Illinois Tool Works Inc.
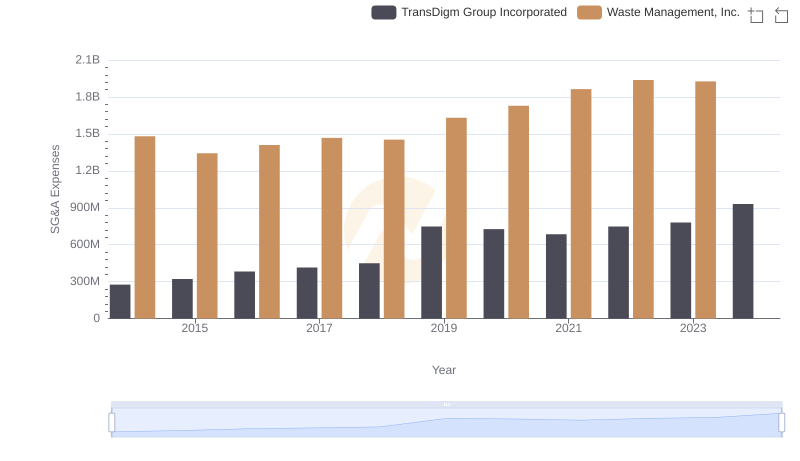
Waste Management, Inc. and TransDigm Group Incorporated: SG&A Spending Patterns Compared
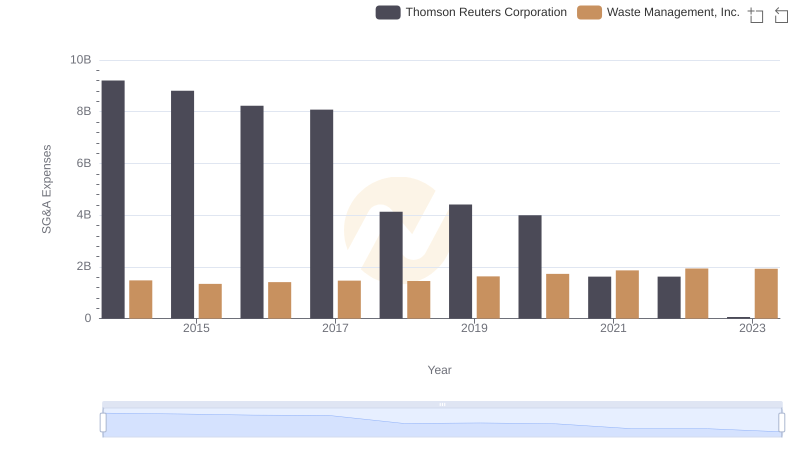
Waste Management, Inc. and Thomson Reuters Corporation: SG&A Spending Patterns Compared
Waste Management, Inc. vs Northrop Grumman Corporation: SG&A Expense Trends