| __timestamp | Northrop Grumman Corporation | Waste Management, Inc. |
|---|---|---|
| Wednesday, January 1, 2014 | 2405000000 | 1481000000 |
| Thursday, January 1, 2015 | 2566000000 | 1343000000 |
| Friday, January 1, 2016 | 2584000000 | 1410000000 |
| Sunday, January 1, 2017 | 2655000000 | 1468000000 |
| Monday, January 1, 2018 | 3011000000 | 1453000000 |
| Tuesday, January 1, 2019 | 3290000000 | 1631000000 |
| Wednesday, January 1, 2020 | 3413000000 | 1728000000 |
| Friday, January 1, 2021 | 3597000000 | 1864000000 |
| Saturday, January 1, 2022 | 3873000000 | 1938000000 |
| Sunday, January 1, 2023 | 4014000000 | 1926000000 |
| Monday, January 1, 2024 | 3992000000 | 2264000000 |
Data in motion
In the world of corporate finance, understanding the trends in Selling, General, and Administrative (SG&A) expenses can offer valuable insights into a company's operational efficiency. Over the past decade, Northrop Grumman Corporation and Waste Management, Inc. have shown distinct trajectories in their SG&A expenses.
From 2014 to 2023, Northrop Grumman's SG&A expenses have surged by approximately 67%, reflecting a strategic expansion and increased operational costs. This growth, from $2.4 billion to over $4 billion, underscores the company's commitment to maintaining its competitive edge in the defense sector.
Conversely, Waste Management, Inc. has seen a more modest increase of around 30% in the same period. Starting at $1.34 billion in 2015, their expenses reached nearly $1.93 billion by 2023. This steady rise highlights the company's focus on sustainable growth and operational efficiency in the waste management industry.
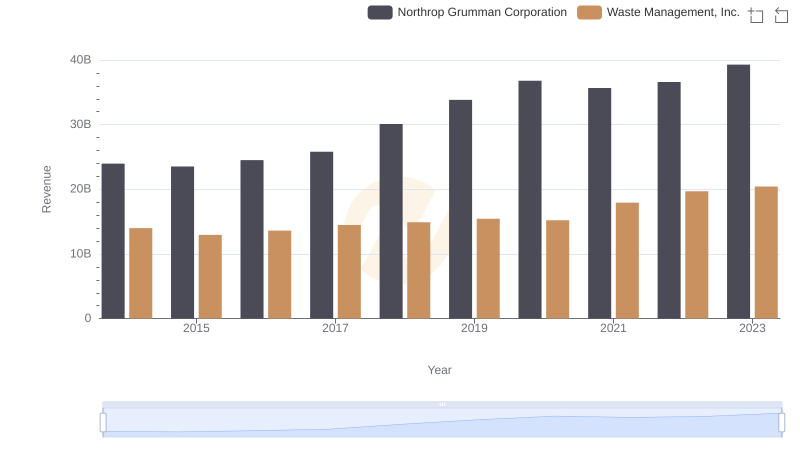
Waste Management, Inc. vs Northrop Grumman Corporation: Annual Revenue Growth Compared
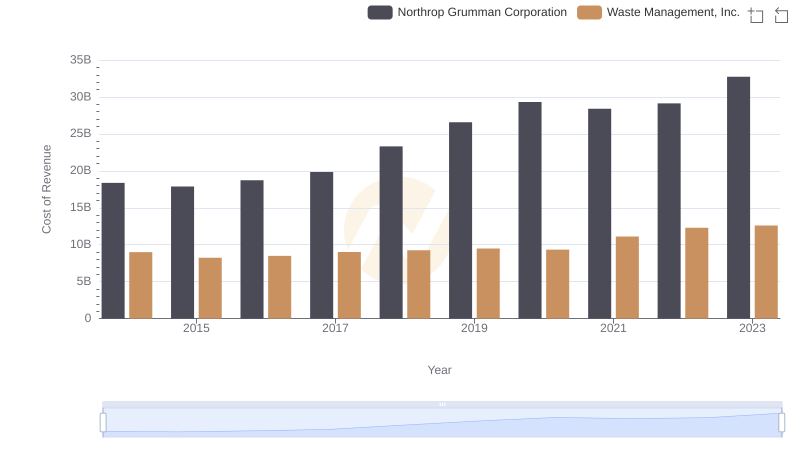
Cost Insights: Breaking Down Waste Management, Inc. and Northrop Grumman Corporation's Expenses
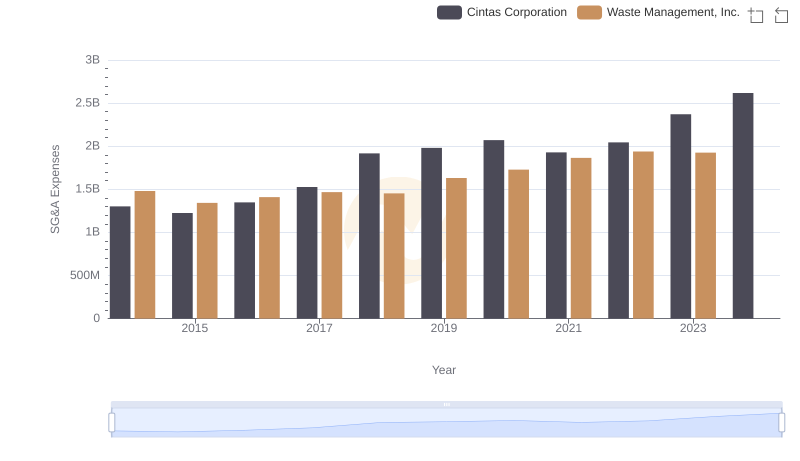
Breaking Down SG&A Expenses: Waste Management, Inc. vs Cintas Corporation
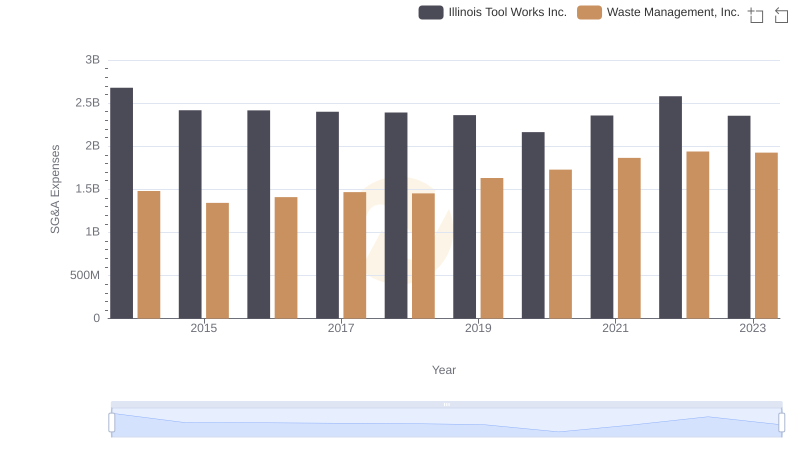
Operational Costs Compared: SG&A Analysis of Waste Management, Inc. and Illinois Tool Works Inc.
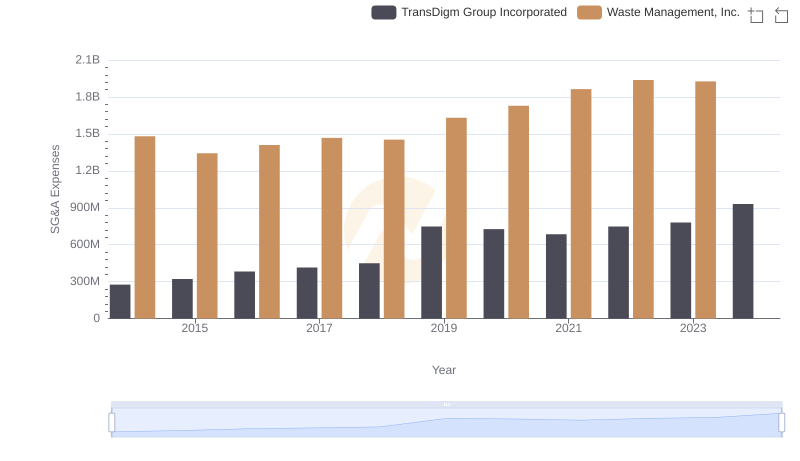
Waste Management, Inc. and TransDigm Group Incorporated: SG&A Spending Patterns Compared
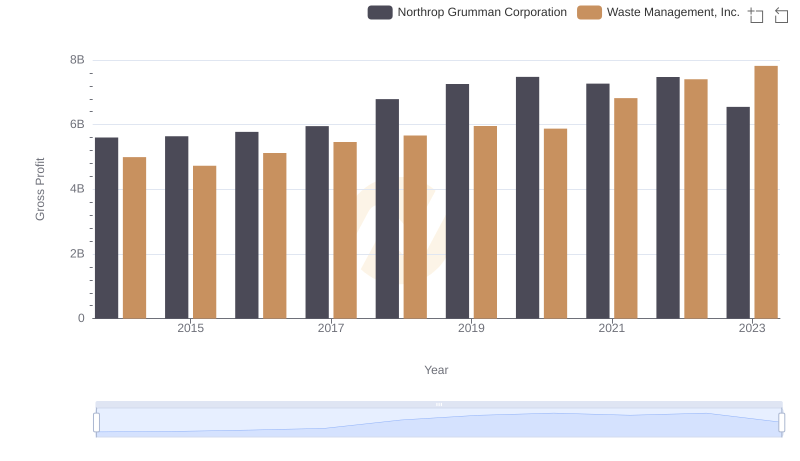
Gross Profit Analysis: Comparing Waste Management, Inc. and Northrop Grumman Corporation
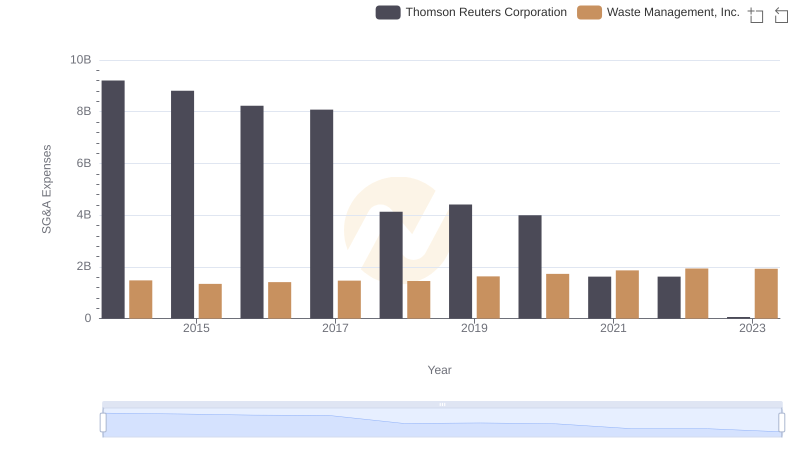
Waste Management, Inc. and Thomson Reuters Corporation: SG&A Spending Patterns Compared

Breaking Down SG&A Expenses: Waste Management, Inc. vs Republic Services, Inc.
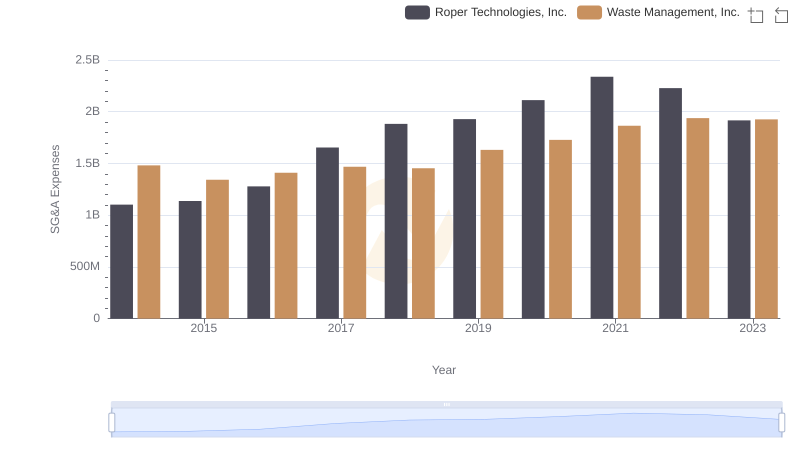
Who Optimizes SG&A Costs Better? Waste Management, Inc. or Roper Technologies, Inc.
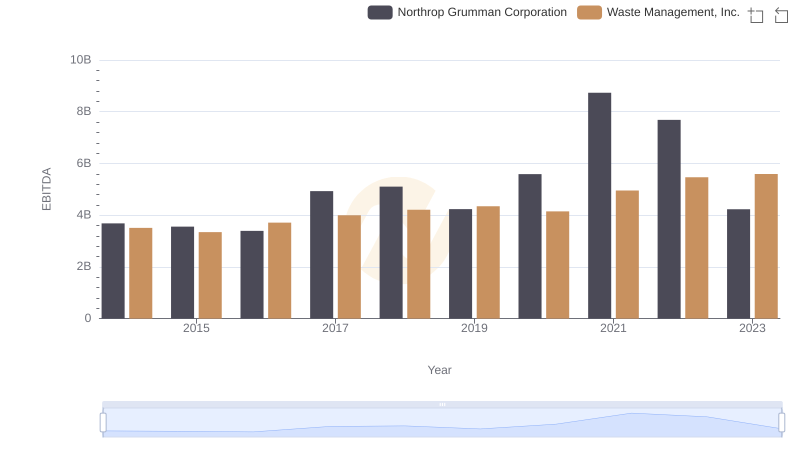
Waste Management, Inc. and Northrop Grumman Corporation: A Detailed Examination of EBITDA Performance