| __timestamp | Parker-Hannifin Corporation | Waste Management, Inc. |
|---|---|---|
| Wednesday, January 1, 2014 | 1633992000 | 1481000000 |
| Thursday, January 1, 2015 | 1544746000 | 1343000000 |
| Friday, January 1, 2016 | 1359360000 | 1410000000 |
| Sunday, January 1, 2017 | 1453935000 | 1468000000 |
| Monday, January 1, 2018 | 1657152000 | 1453000000 |
| Tuesday, January 1, 2019 | 1543939000 | 1631000000 |
| Wednesday, January 1, 2020 | 1656553000 | 1728000000 |
| Friday, January 1, 2021 | 1527302000 | 1864000000 |
| Saturday, January 1, 2022 | 1627116000 | 1938000000 |
| Sunday, January 1, 2023 | 3354103000 | 1926000000 |
| Monday, January 1, 2024 | 3315177000 | 2264000000 |
Unlocking the unknown
In the ever-evolving landscape of corporate finance, understanding operational costs is crucial. Over the past decade, Parker-Hannifin Corporation and Waste Management, Inc. have showcased intriguing trends in their Selling, General, and Administrative (SG&A) expenses. From 2014 to 2023, Parker-Hannifin's SG&A expenses surged by over 100%, peaking in 2023. This dramatic increase highlights a strategic shift or expansion in operations. In contrast, Waste Management, Inc. exhibited a steadier growth, with a notable 35% rise from 2014 to 2022, before a slight dip in 2023. The data reveals a fascinating narrative of corporate strategy and market adaptation. Missing data for 2024 suggests potential reporting delays or strategic changes. As businesses navigate economic challenges, these insights into SG&A trends offer a window into their operational priorities and financial health.
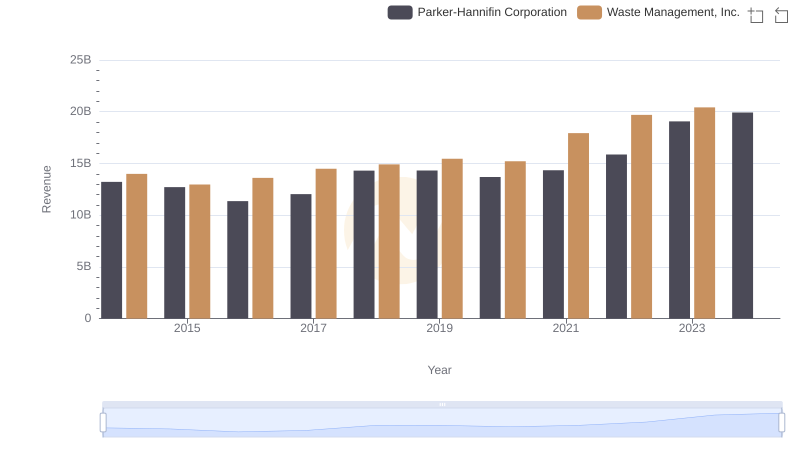
Waste Management, Inc. and Parker-Hannifin Corporation: A Comprehensive Revenue Analysis
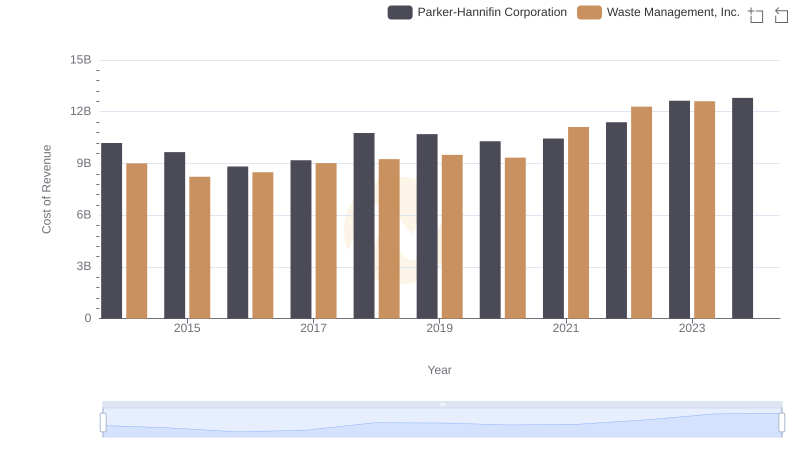
Cost Insights: Breaking Down Waste Management, Inc. and Parker-Hannifin Corporation's Expenses
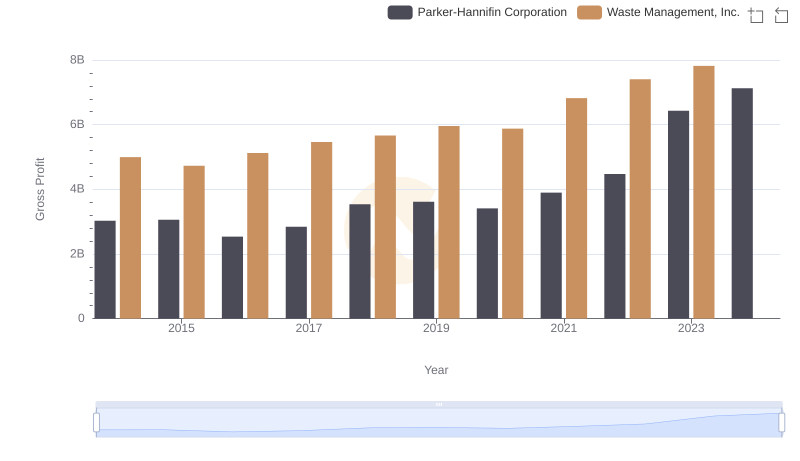
Who Generates Higher Gross Profit? Waste Management, Inc. or Parker-Hannifin Corporation
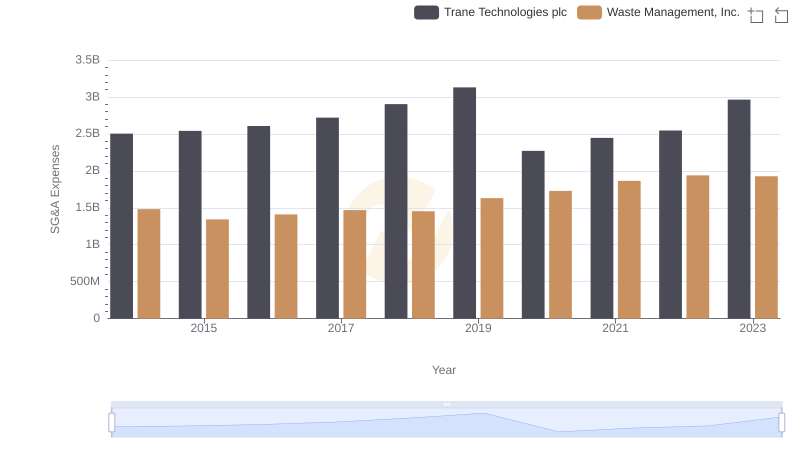
Comparing SG&A Expenses: Waste Management, Inc. vs Trane Technologies plc Trends and Insights
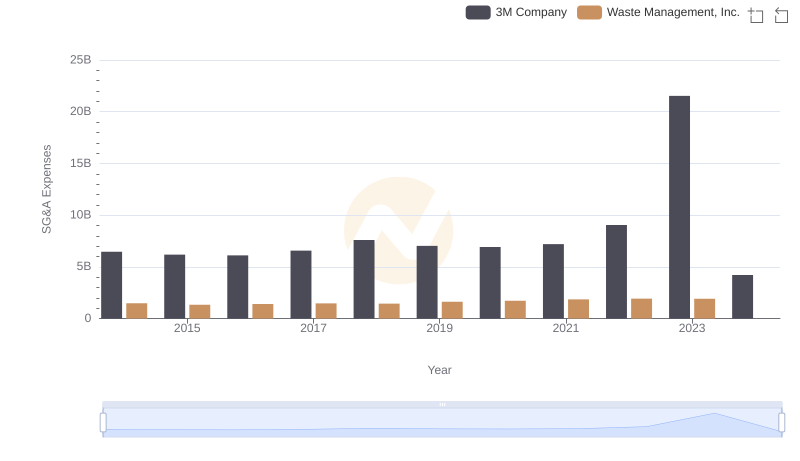
Selling, General, and Administrative Costs: Waste Management, Inc. vs 3M Company
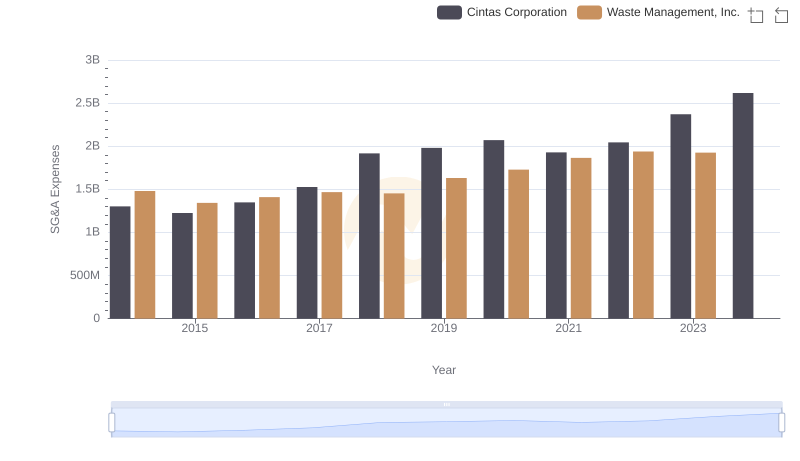
Breaking Down SG&A Expenses: Waste Management, Inc. vs Cintas Corporation
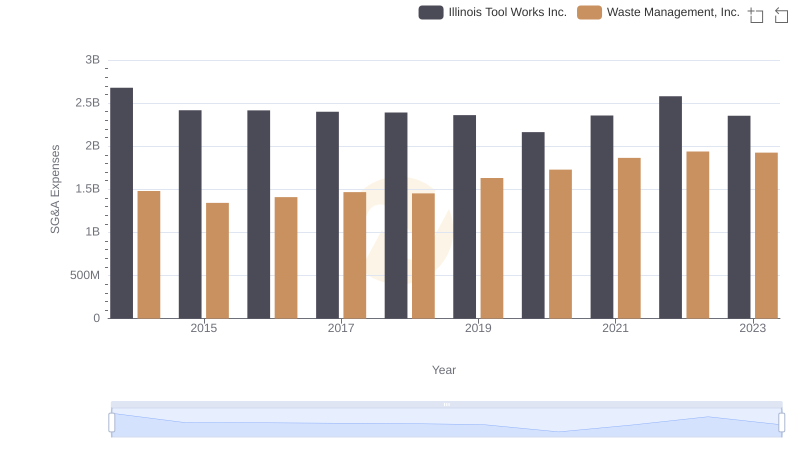
Operational Costs Compared: SG&A Analysis of Waste Management, Inc. and Illinois Tool Works Inc.
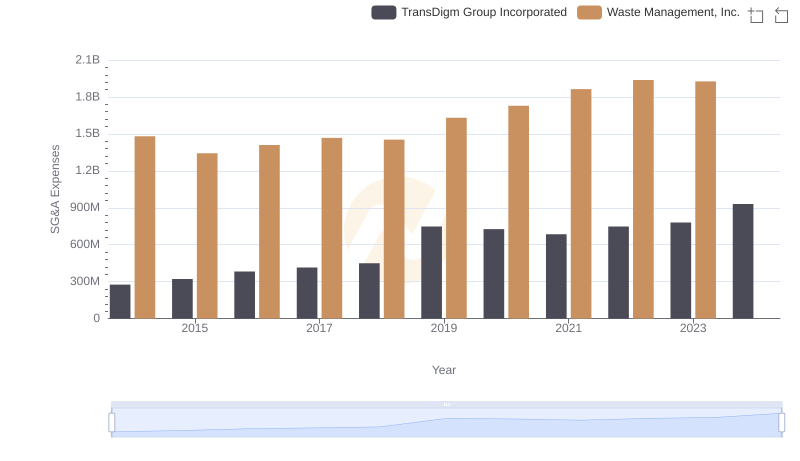
Waste Management, Inc. and TransDigm Group Incorporated: SG&A Spending Patterns Compared
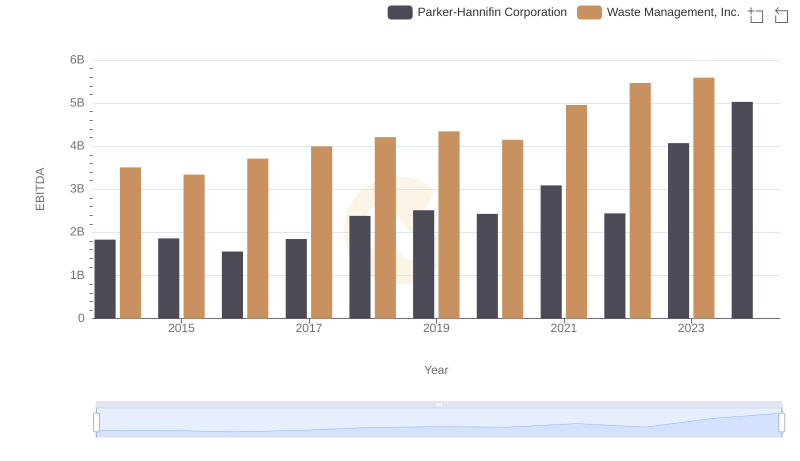
EBITDA Analysis: Evaluating Waste Management, Inc. Against Parker-Hannifin Corporation
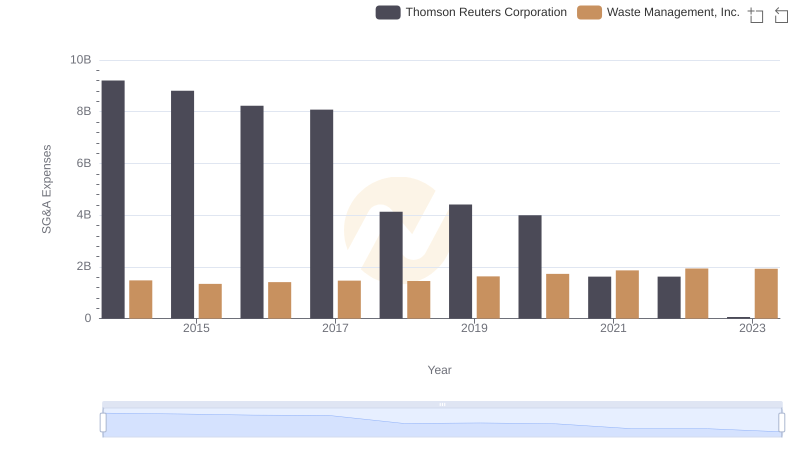
Waste Management, Inc. and Thomson Reuters Corporation: SG&A Spending Patterns Compared
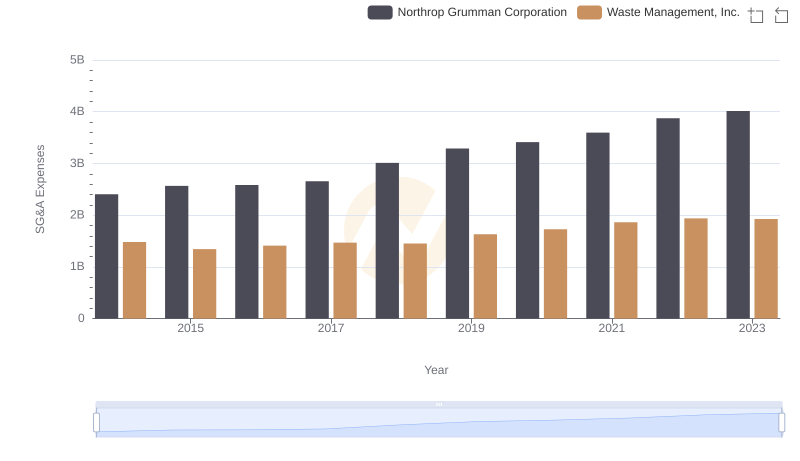
Waste Management, Inc. vs Northrop Grumman Corporation: SG&A Expense Trends