| __timestamp | TransDigm Group Incorporated | Waste Management, Inc. |
|---|---|---|
| Wednesday, January 1, 2014 | 276446000 | 1481000000 |
| Thursday, January 1, 2015 | 321624000 | 1343000000 |
| Friday, January 1, 2016 | 382858000 | 1410000000 |
| Sunday, January 1, 2017 | 415575000 | 1468000000 |
| Monday, January 1, 2018 | 450095000 | 1453000000 |
| Tuesday, January 1, 2019 | 747773000 | 1631000000 |
| Wednesday, January 1, 2020 | 727000000 | 1728000000 |
| Friday, January 1, 2021 | 685000000 | 1864000000 |
| Saturday, January 1, 2022 | 748000000 | 1938000000 |
| Sunday, January 1, 2023 | 780000000 | 1926000000 |
| Monday, January 1, 2024 | 931000000 | 2264000000 |
Cracking the code
In the world of corporate finance, understanding the spending patterns of industry leaders can offer valuable insights. Waste Management, Inc. and TransDigm Group Incorporated, two titans in their respective fields, have shown distinct trends in their Selling, General, and Administrative (SG&A) expenses over the past decade.
From 2014 to 2023, Waste Management's SG&A expenses have consistently outpaced those of TransDigm, with a peak in 2022 at nearly $1.94 billion. This represents a steady increase of approximately 30% from their 2014 figures. In contrast, TransDigm's SG&A expenses have shown a more volatile pattern, with a significant jump of over 230% from 2014 to 2024, reaching $931 million.
These trends highlight the differing strategic priorities and operational scales of these companies. While Waste Management's expenses reflect a stable growth trajectory, TransDigm's fluctuations suggest a more dynamic approach to managing operational costs.
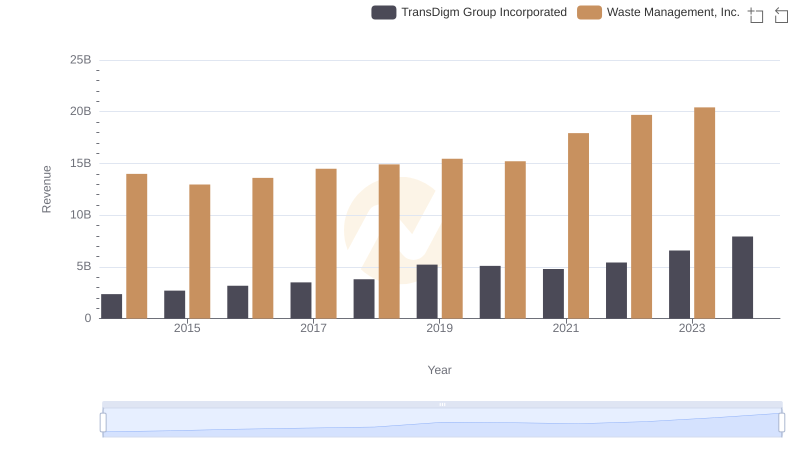
Breaking Down Revenue Trends: Waste Management, Inc. vs TransDigm Group Incorporated
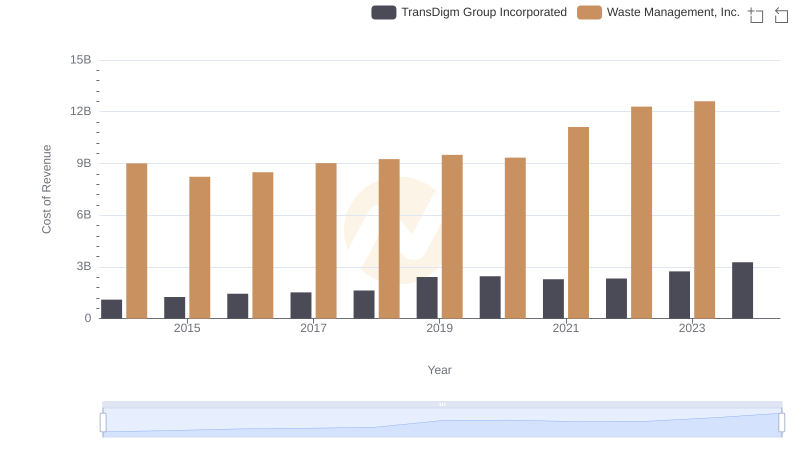
Cost of Revenue: Key Insights for Waste Management, Inc. and TransDigm Group Incorporated
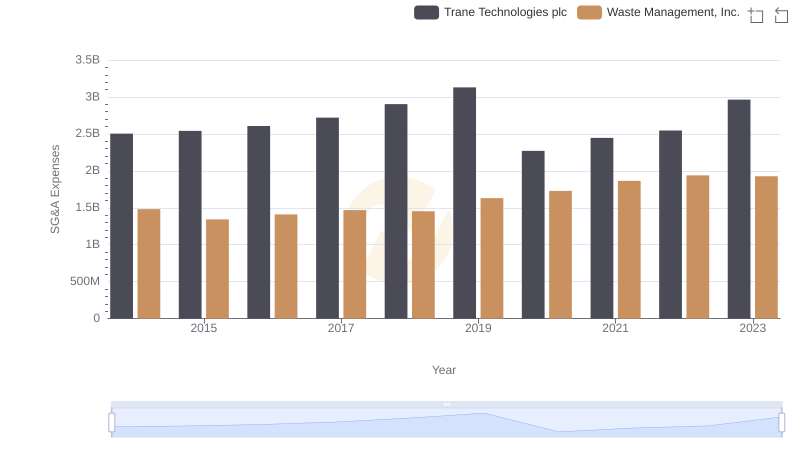
Comparing SG&A Expenses: Waste Management, Inc. vs Trane Technologies plc Trends and Insights
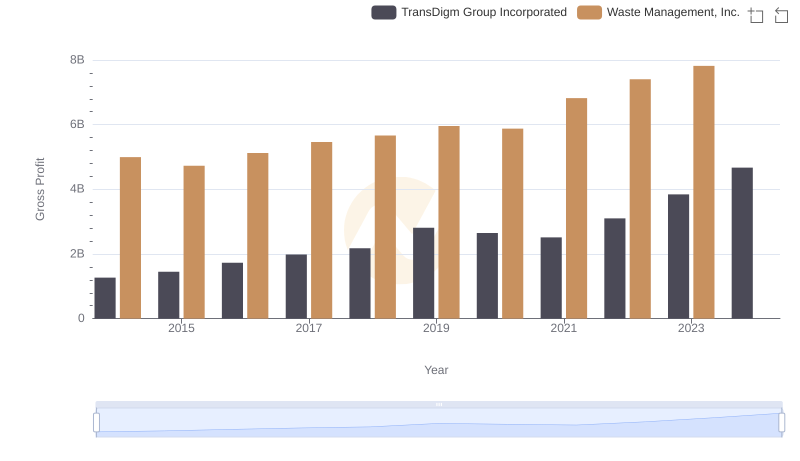
Gross Profit Analysis: Comparing Waste Management, Inc. and TransDigm Group Incorporated
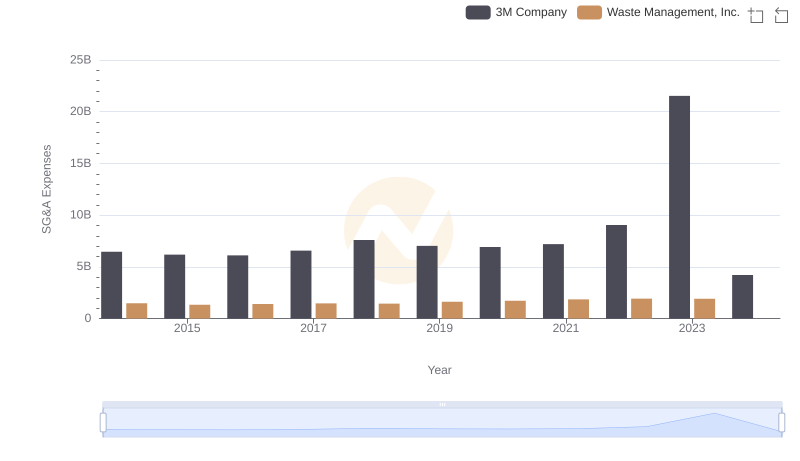
Selling, General, and Administrative Costs: Waste Management, Inc. vs 3M Company
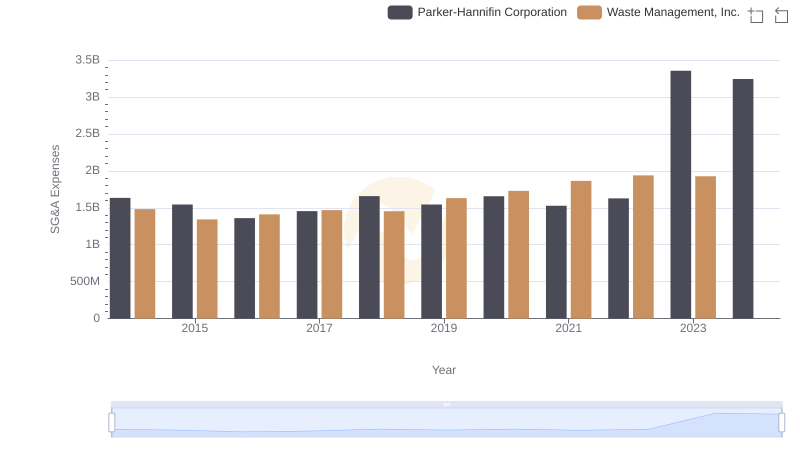
Operational Costs Compared: SG&A Analysis of Waste Management, Inc. and Parker-Hannifin Corporation
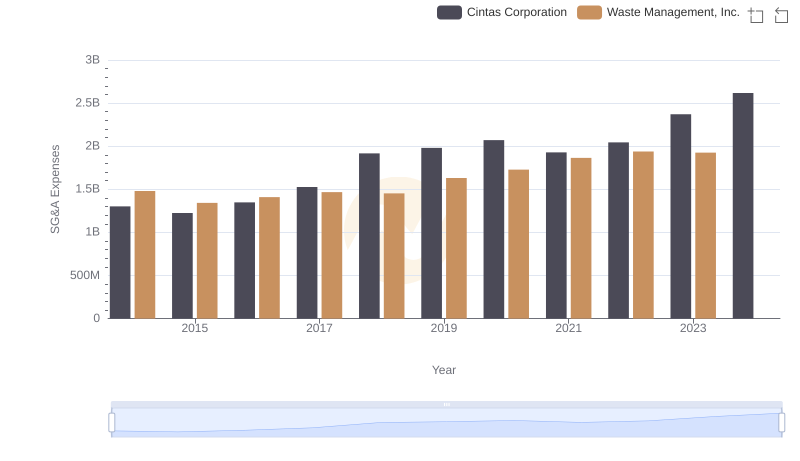
Breaking Down SG&A Expenses: Waste Management, Inc. vs Cintas Corporation
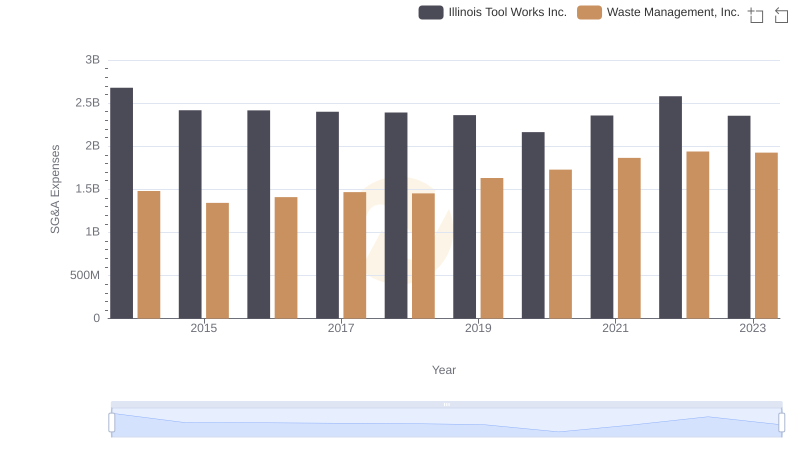
Operational Costs Compared: SG&A Analysis of Waste Management, Inc. and Illinois Tool Works Inc.
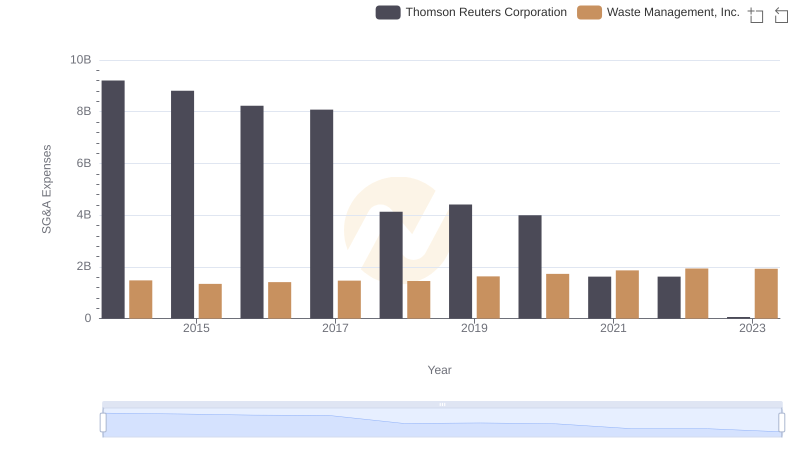
Waste Management, Inc. and Thomson Reuters Corporation: SG&A Spending Patterns Compared
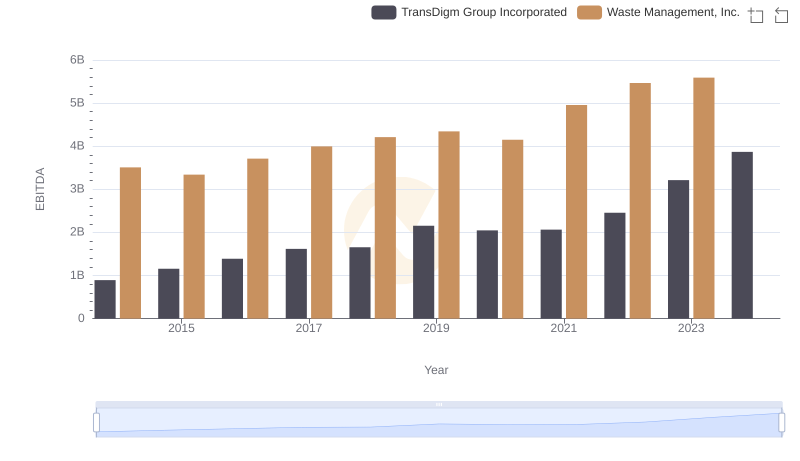
Waste Management, Inc. vs TransDigm Group Incorporated: In-Depth EBITDA Performance Comparison
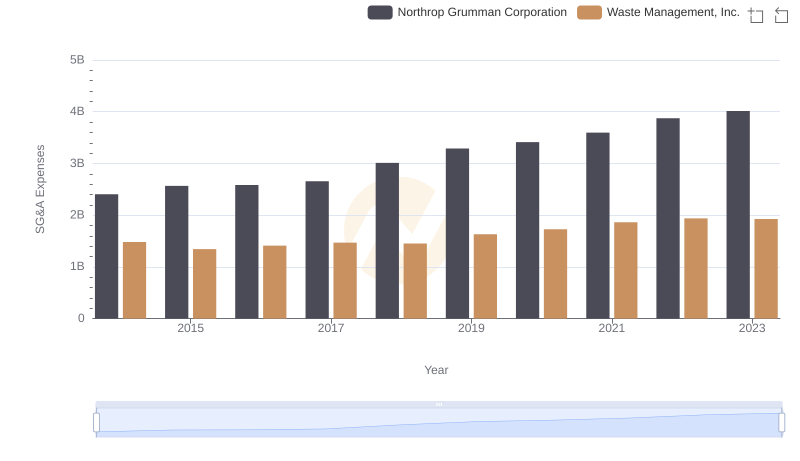
Waste Management, Inc. vs Northrop Grumman Corporation: SG&A Expense Trends