| __timestamp | Trane Technologies plc | Waste Management, Inc. |
|---|---|---|
| Wednesday, January 1, 2014 | 8982800000 | 9002000000 |
| Thursday, January 1, 2015 | 9301600000 | 8231000000 |
| Friday, January 1, 2016 | 9329300000 | 8486000000 |
| Sunday, January 1, 2017 | 9811600000 | 9021000000 |
| Monday, January 1, 2018 | 10847600000 | 9249000000 |
| Tuesday, January 1, 2019 | 11451500000 | 9496000000 |
| Wednesday, January 1, 2020 | 8651300000 | 9341000000 |
| Friday, January 1, 2021 | 9666800000 | 11111000000 |
| Saturday, January 1, 2022 | 11026900000 | 12294000000 |
| Sunday, January 1, 2023 | 11820400000 | 12606000000 |
| Monday, January 1, 2024 | 12757700000 | 13383000000 |
Infusing magic into the data realm
In the ever-evolving landscape of corporate finance, understanding cost structures is pivotal. Waste Management, Inc. and Trane Technologies plc, two giants in their respective industries, have shown intriguing trends in their cost of revenue over the past decade. From 2014 to 2023, Waste Management's cost of revenue increased by approximately 40%, peaking in 2023. Meanwhile, Trane Technologies saw a similar upward trajectory, with a notable 32% rise over the same period.
These trends highlight the resilience and adaptability of these companies in navigating economic challenges.
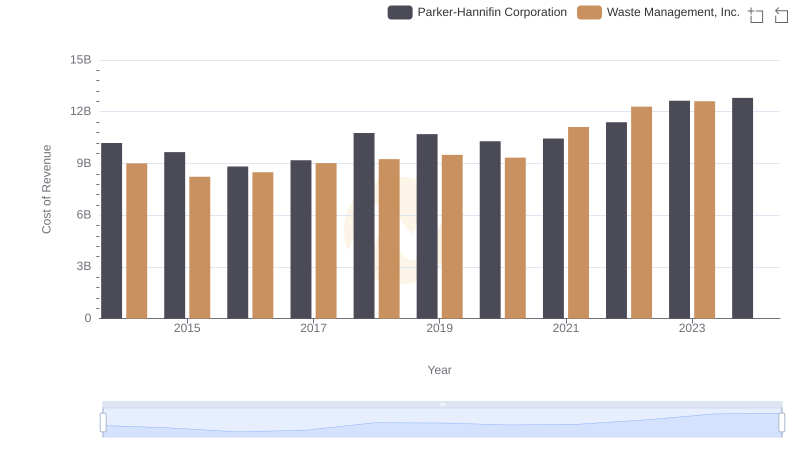
Cost Insights: Breaking Down Waste Management, Inc. and Parker-Hannifin Corporation's Expenses
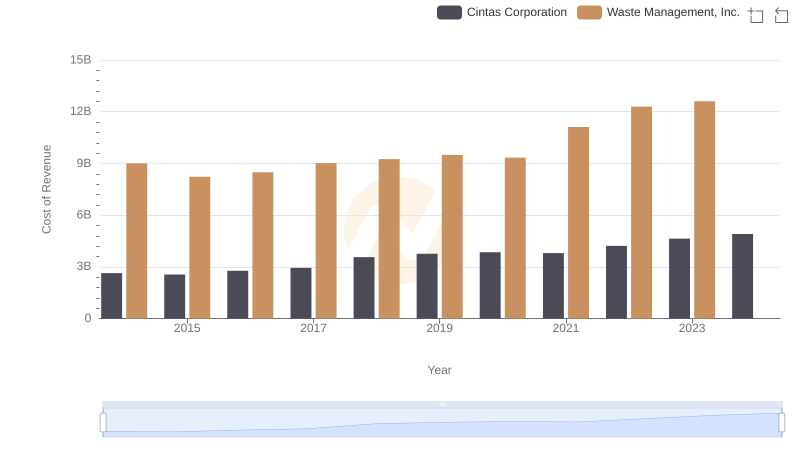
Cost of Revenue Trends: Waste Management, Inc. vs Cintas Corporation
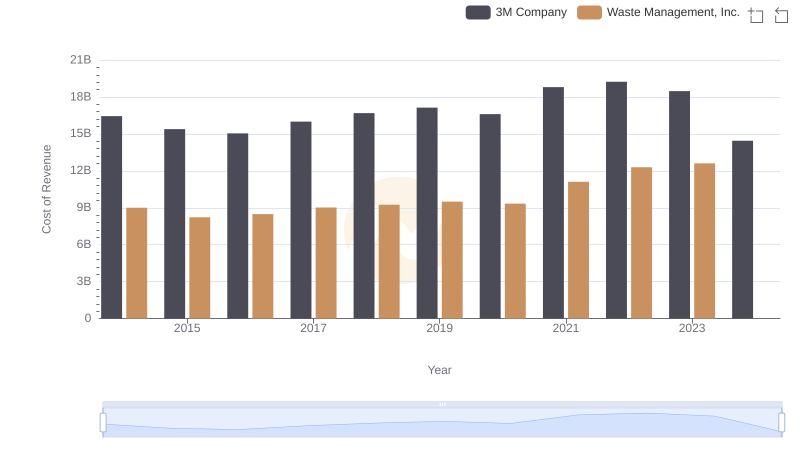
Comparing Cost of Revenue Efficiency: Waste Management, Inc. vs 3M Company
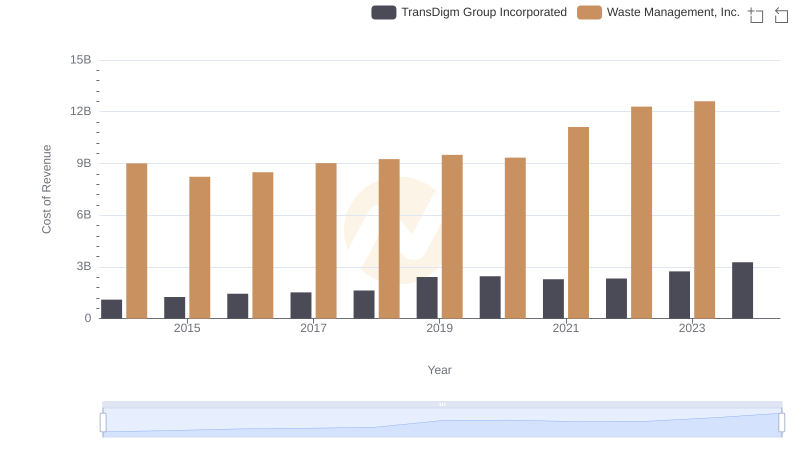
Cost of Revenue: Key Insights for Waste Management, Inc. and TransDigm Group Incorporated
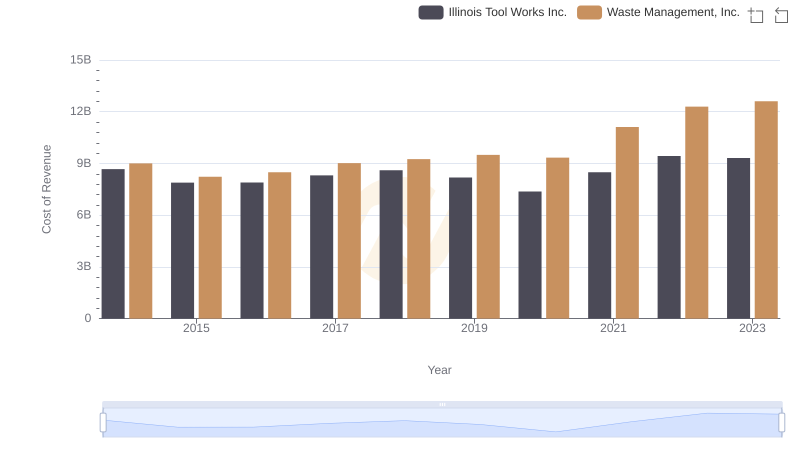
Cost Insights: Breaking Down Waste Management, Inc. and Illinois Tool Works Inc.'s Expenses

Gross Profit Trends Compared: Waste Management, Inc. vs Trane Technologies plc
Comparing Cost of Revenue Efficiency: Waste Management, Inc. vs Thomson Reuters Corporation
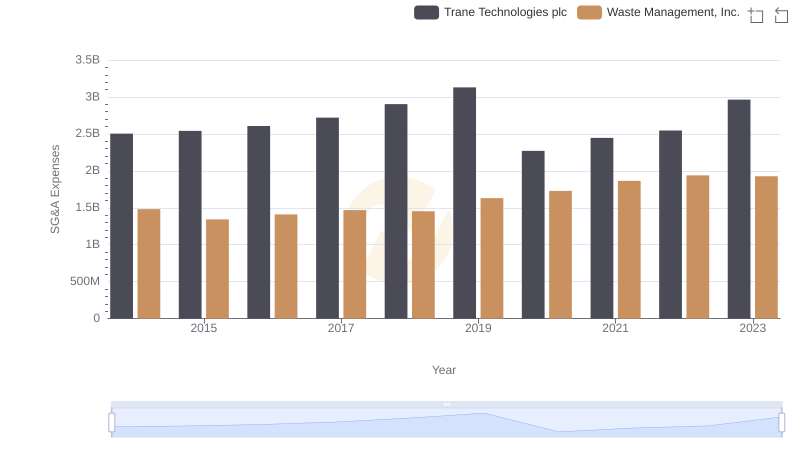
Comparing SG&A Expenses: Waste Management, Inc. vs Trane Technologies plc Trends and Insights
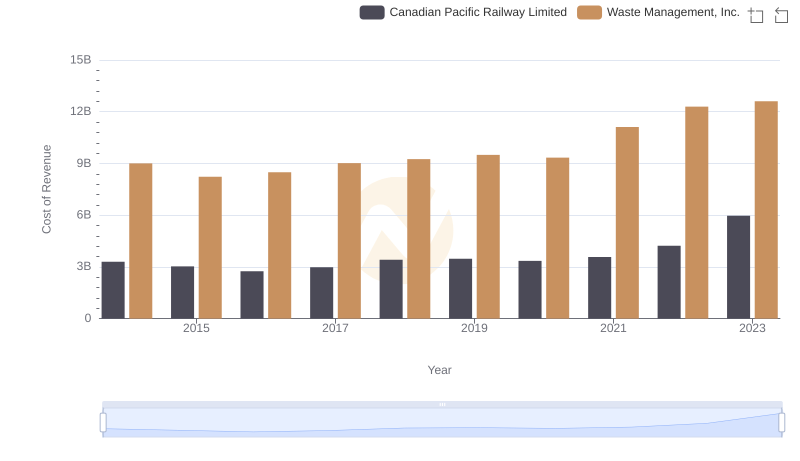
Comparing Cost of Revenue Efficiency: Waste Management, Inc. vs Canadian Pacific Railway Limited
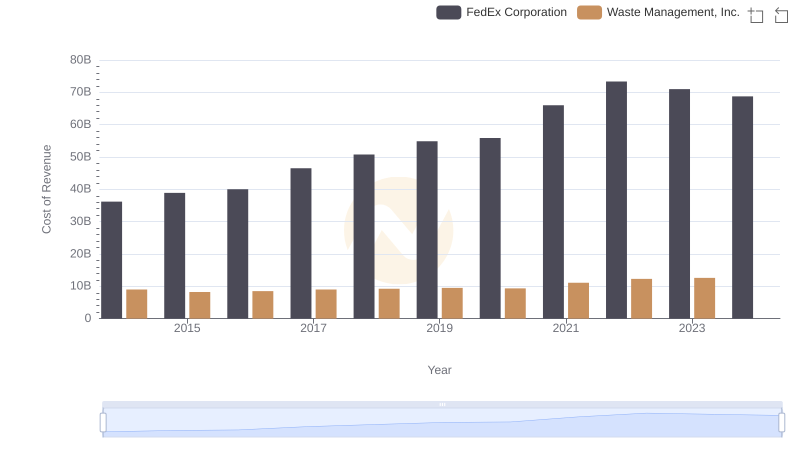
Comparing Cost of Revenue Efficiency: Waste Management, Inc. vs FedEx Corporation
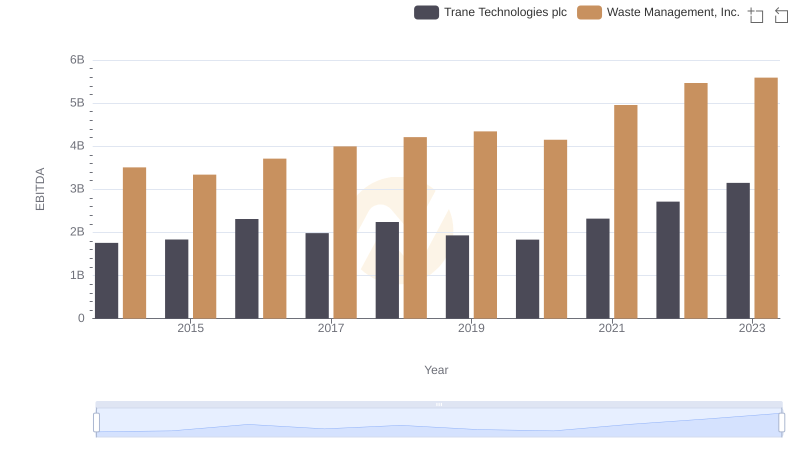
Professional EBITDA Benchmarking: Waste Management, Inc. vs Trane Technologies plc