| __timestamp | Trane Technologies plc | Waste Management, Inc. |
|---|---|---|
| Wednesday, January 1, 2014 | 1757000000 | 3509000000 |
| Thursday, January 1, 2015 | 1835000000 | 3342000000 |
| Friday, January 1, 2016 | 2311000000 | 3713000000 |
| Sunday, January 1, 2017 | 1982500000 | 3996000000 |
| Monday, January 1, 2018 | 2242400000 | 4212000000 |
| Tuesday, January 1, 2019 | 1931200000 | 4344000000 |
| Wednesday, January 1, 2020 | 1831900000 | 4149000000 |
| Friday, January 1, 2021 | 2319200000 | 4956000000 |
| Saturday, January 1, 2022 | 2715500000 | 5466000000 |
| Sunday, January 1, 2023 | 3149900000 | 5592000000 |
| Monday, January 1, 2024 | 3859600000 | 5128000000 |
Unleashing the power of data
In the ever-evolving landscape of environmental services and climate solutions, Waste Management, Inc. and Trane Technologies plc stand as industry titans. Over the past decade, from 2014 to 2023, these companies have demonstrated remarkable financial resilience and growth. Waste Management, Inc. has consistently outperformed Trane Technologies plc, with an average EBITDA nearly double that of its competitor. Notably, Waste Management's EBITDA surged by approximately 59% from 2014 to 2023, peaking at 5.6 billion in 2023. Meanwhile, Trane Technologies plc experienced a robust 79% growth in the same period, reaching 3.1 billion in 2023. This data underscores the dynamic nature of the waste management and climate control sectors, highlighting the importance of strategic financial management in achieving sustainable growth. As the world increasingly prioritizes environmental sustainability, these companies are well-positioned to lead the charge.
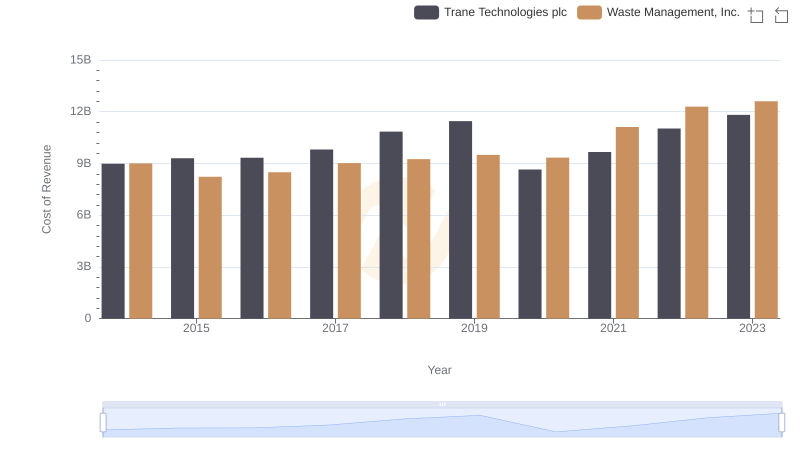
Cost of Revenue Trends: Waste Management, Inc. vs Trane Technologies plc

Gross Profit Trends Compared: Waste Management, Inc. vs Trane Technologies plc
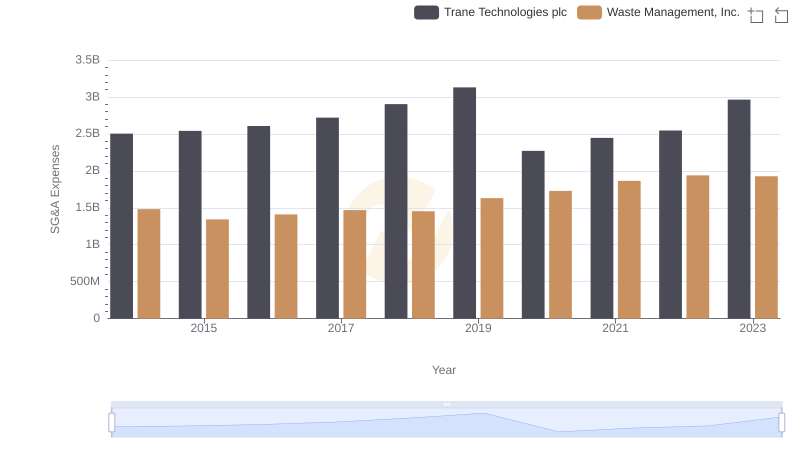
Comparing SG&A Expenses: Waste Management, Inc. vs Trane Technologies plc Trends and Insights
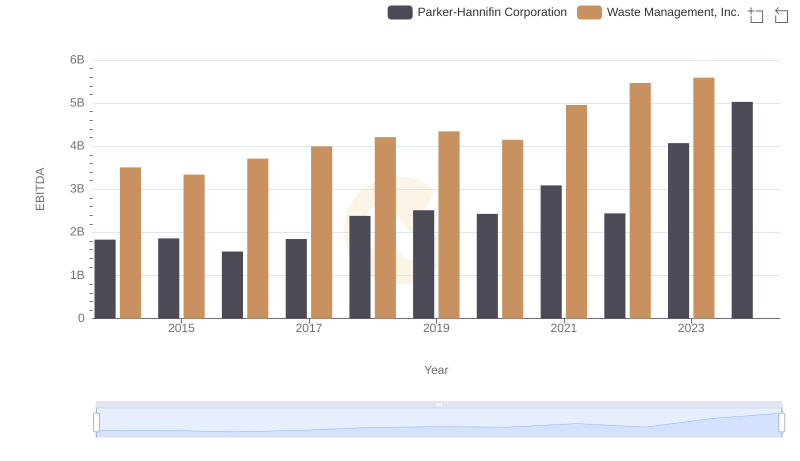
EBITDA Analysis: Evaluating Waste Management, Inc. Against Parker-Hannifin Corporation
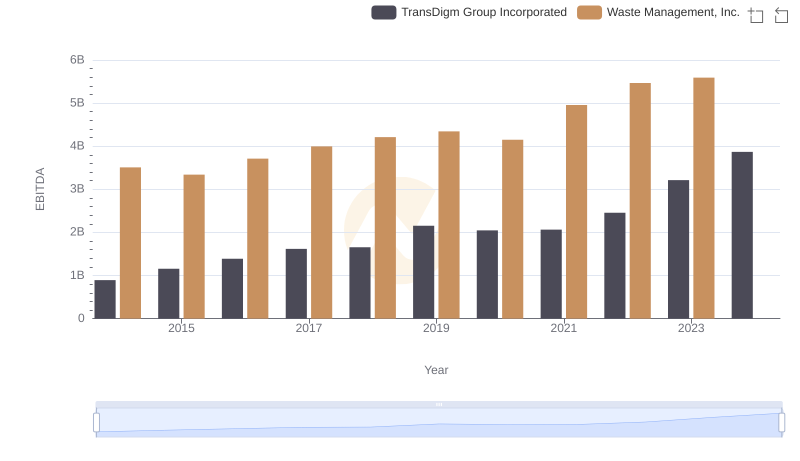
Waste Management, Inc. vs TransDigm Group Incorporated: In-Depth EBITDA Performance Comparison
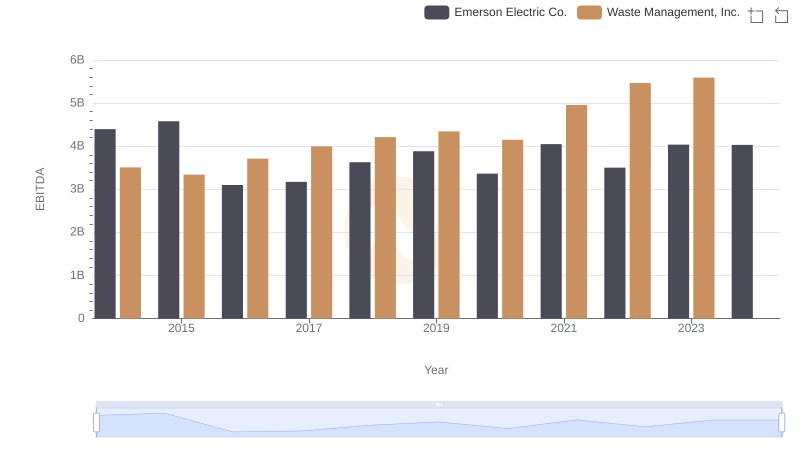
A Side-by-Side Analysis of EBITDA: Waste Management, Inc. and Emerson Electric Co.
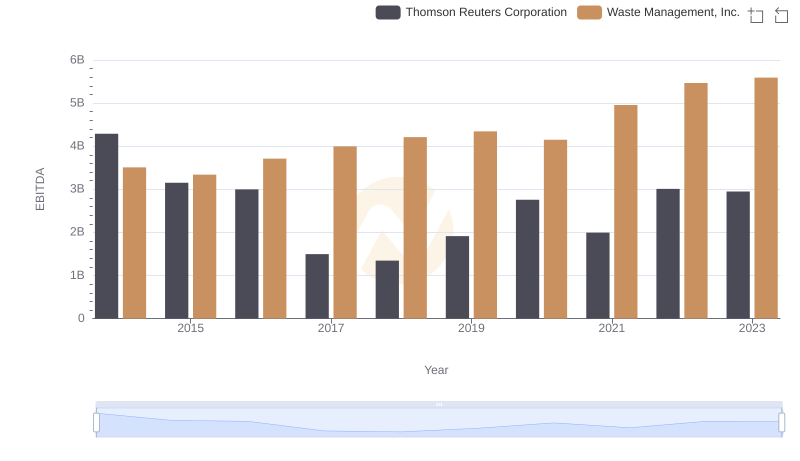
EBITDA Performance Review: Waste Management, Inc. vs Thomson Reuters Corporation

Professional EBITDA Benchmarking: Waste Management, Inc. vs FedEx Corporation
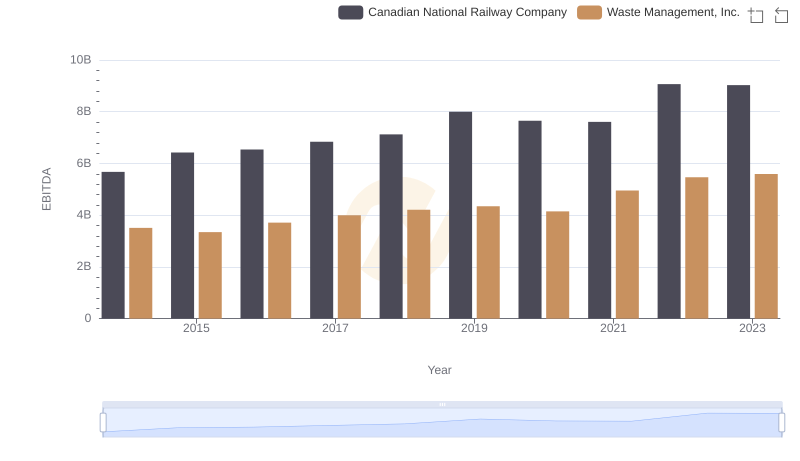
Comparative EBITDA Analysis: Waste Management, Inc. vs Canadian National Railway Company