| __timestamp | Trane Technologies plc | Waste Management, Inc. |
|---|---|---|
| Wednesday, January 1, 2014 | 3908600000 | 4994000000 |
| Thursday, January 1, 2015 | 3999100000 | 4730000000 |
| Friday, January 1, 2016 | 4179600000 | 5123000000 |
| Sunday, January 1, 2017 | 4386000000 | 5464000000 |
| Monday, January 1, 2018 | 4820600000 | 5665000000 |
| Tuesday, January 1, 2019 | 5147400000 | 5959000000 |
| Wednesday, January 1, 2020 | 3803400000 | 5877000000 |
| Friday, January 1, 2021 | 4469600000 | 6820000000 |
| Saturday, January 1, 2022 | 4964800000 | 7404000000 |
| Sunday, January 1, 2023 | 5857200000 | 7820000000 |
| Monday, January 1, 2024 | 7080500000 | 8680000000 |
Igniting the spark of knowledge
In the ever-evolving landscape of industrial and waste management sectors, Waste Management, Inc. and Trane Technologies plc have emerged as formidable players. Over the past decade, from 2014 to 2023, these companies have showcased intriguing trends in their gross profits. Waste Management, Inc. has consistently outperformed, with a peak gross profit of approximately $7.82 billion in 2023, marking a 57% increase from 2014. Meanwhile, Trane Technologies plc has demonstrated resilience, rebounding from a dip in 2020 to achieve a 50% growth by 2023, reaching around $5.86 billion. This comparison not only highlights the robust growth trajectories of these industry leaders but also underscores the dynamic nature of their respective markets. As we delve deeper into these trends, it becomes evident that strategic innovation and market adaptation are key drivers of their financial success.
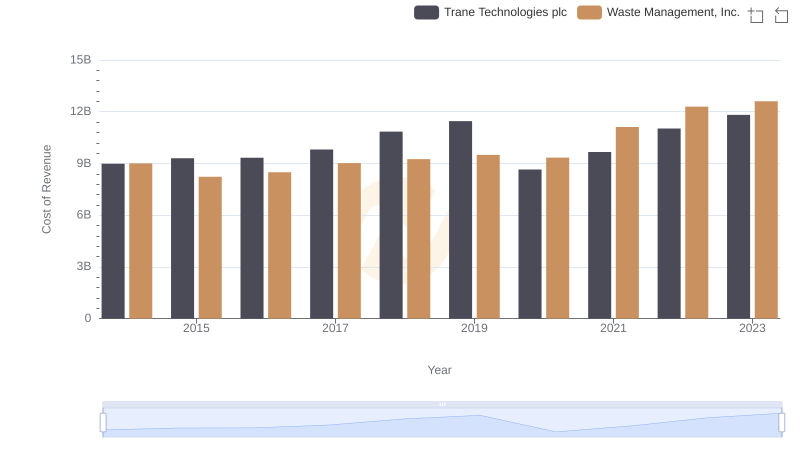
Cost of Revenue Trends: Waste Management, Inc. vs Trane Technologies plc
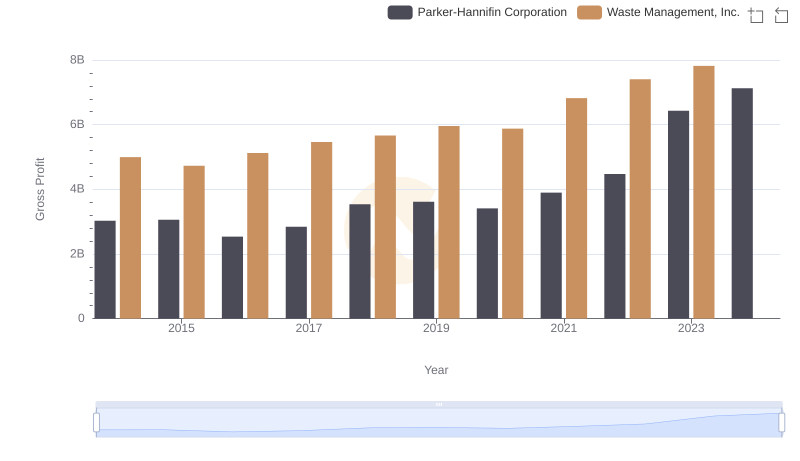
Who Generates Higher Gross Profit? Waste Management, Inc. or Parker-Hannifin Corporation
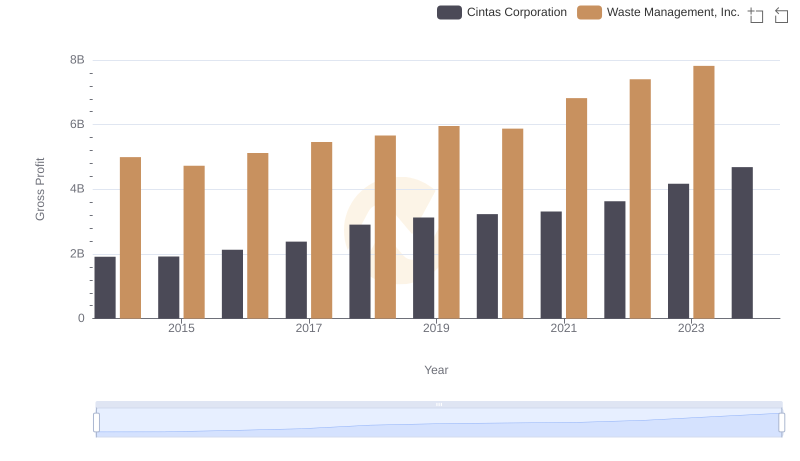
Gross Profit Comparison: Waste Management, Inc. and Cintas Corporation Trends

Who Generates Higher Gross Profit? Waste Management, Inc. or 3M Company
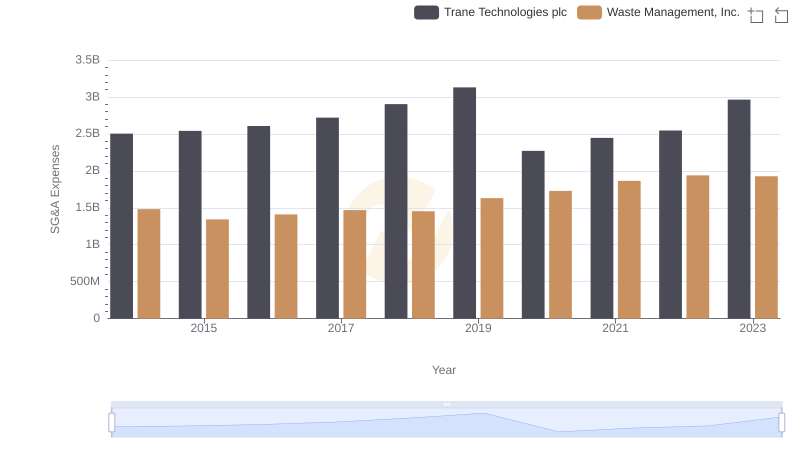
Comparing SG&A Expenses: Waste Management, Inc. vs Trane Technologies plc Trends and Insights
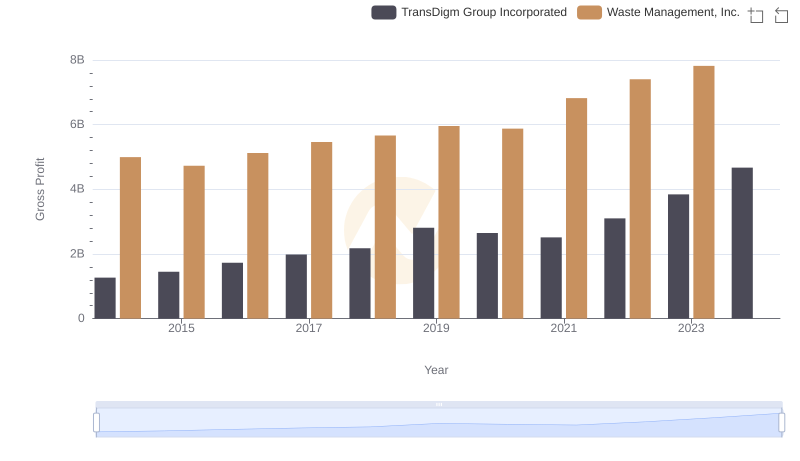
Gross Profit Analysis: Comparing Waste Management, Inc. and TransDigm Group Incorporated
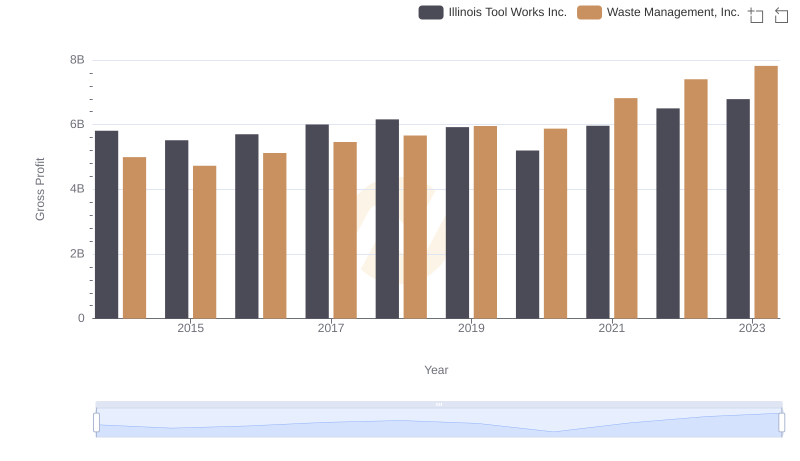
Who Generates Higher Gross Profit? Waste Management, Inc. or Illinois Tool Works Inc.
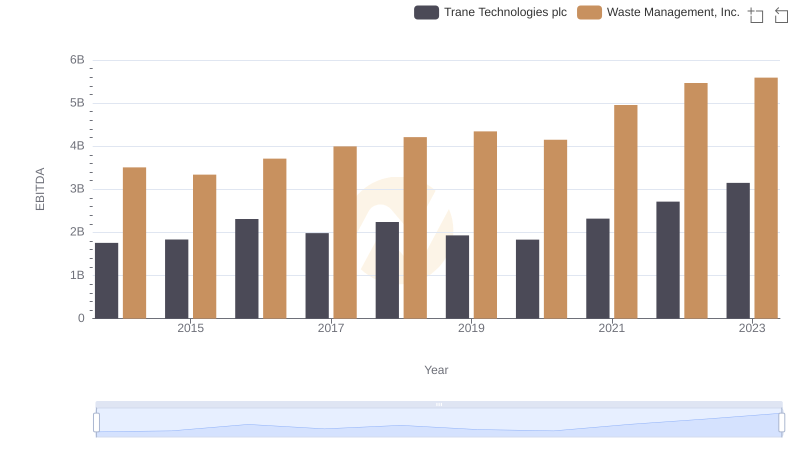
Professional EBITDA Benchmarking: Waste Management, Inc. vs Trane Technologies plc
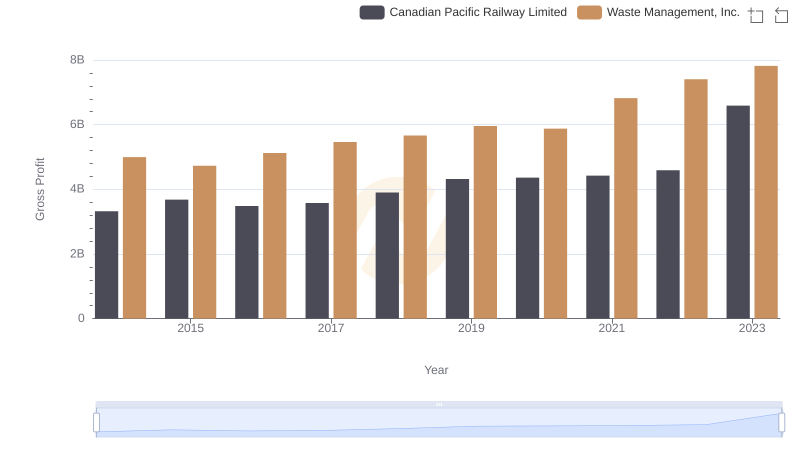
Gross Profit Comparison: Waste Management, Inc. and Canadian Pacific Railway Limited Trends
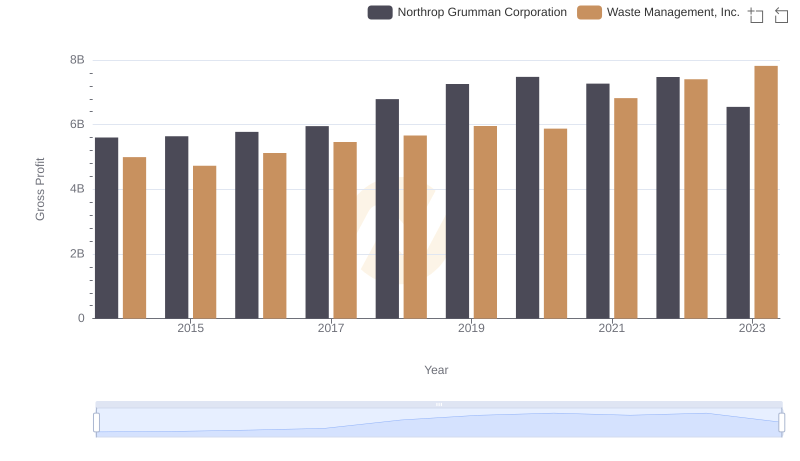
Gross Profit Analysis: Comparing Waste Management, Inc. and Northrop Grumman Corporation