| __timestamp | Avery Dennison Corporation | Rockwell Automation, Inc. |
|---|---|---|
| Wednesday, January 1, 2014 | 1155300000 | 1570100000 |
| Thursday, January 1, 2015 | 1108100000 | 1506400000 |
| Friday, January 1, 2016 | 1097500000 | 1467400000 |
| Sunday, January 1, 2017 | 1123200000 | 1591500000 |
| Monday, January 1, 2018 | 1127500000 | 1599000000 |
| Tuesday, January 1, 2019 | 1080400000 | 1538500000 |
| Wednesday, January 1, 2020 | 1060500000 | 1479800000 |
| Friday, January 1, 2021 | 1248500000 | 1680000000 |
| Saturday, January 1, 2022 | 1330800000 | 1766700000 |
| Sunday, January 1, 2023 | 1177900000 | 2023700000 |
| Monday, January 1, 2024 | 1415300000 | 2002600000 |
Unleashing the power of data
In the competitive landscape of industrial automation and labeling solutions, Rockwell Automation, Inc. and Avery Dennison Corporation have been pivotal players. Over the past decade, their Selling, General, and Administrative (SG&A) expenses have revealed intriguing trends. From 2014 to 2023, Rockwell Automation consistently outpaced Avery Dennison in SG&A spending, peaking in 2023 with a 29% increase from 2014. Avery Dennison, while more conservative, saw a 15% rise in the same period, with a notable spike in 2022. This divergence highlights differing strategic priorities: Rockwell's aggressive expansion versus Avery's steady growth. Notably, 2024 data for Avery Dennison is missing, leaving room for speculation on future strategies. As these industry leaders navigate economic shifts, their SG&A trends offer a window into their evolving business models and market positioning.
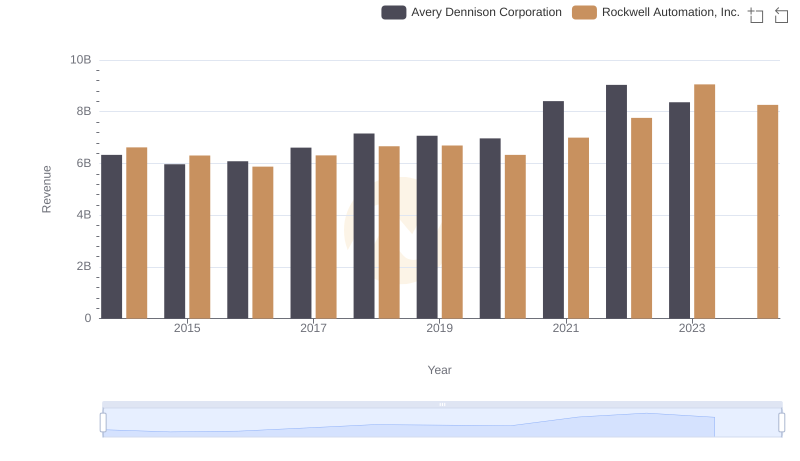
Rockwell Automation, Inc. or Avery Dennison Corporation: Who Leads in Yearly Revenue?
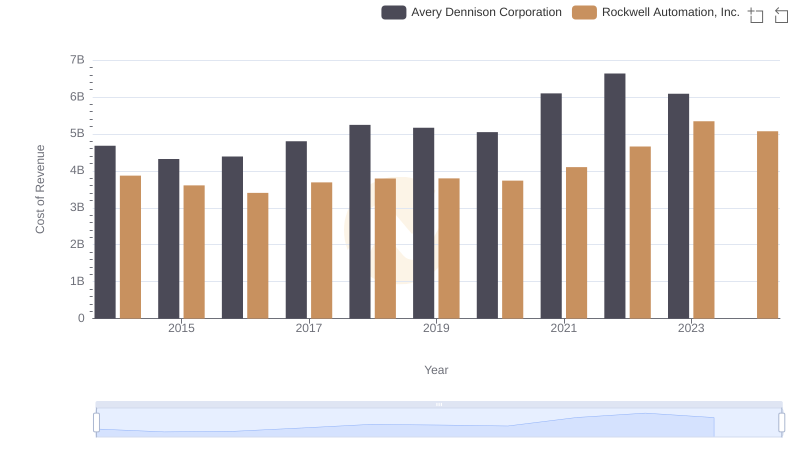
Analyzing Cost of Revenue: Rockwell Automation, Inc. and Avery Dennison Corporation
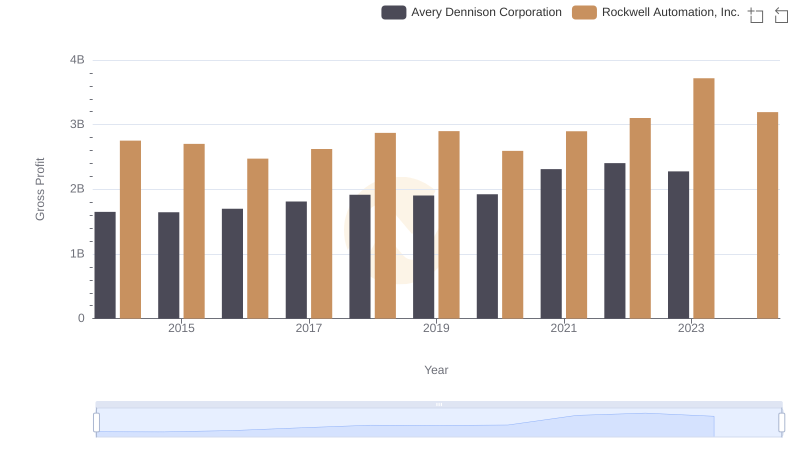
Gross Profit Trends Compared: Rockwell Automation, Inc. vs Avery Dennison Corporation
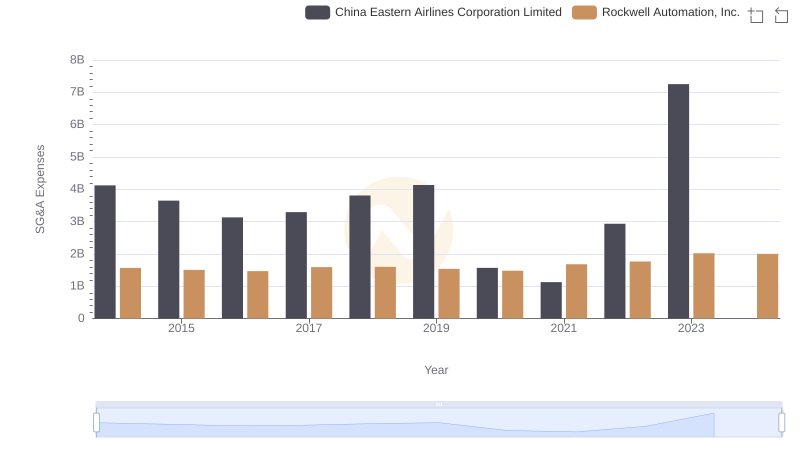
Breaking Down SG&A Expenses: Rockwell Automation, Inc. vs China Eastern Airlines Corporation Limited
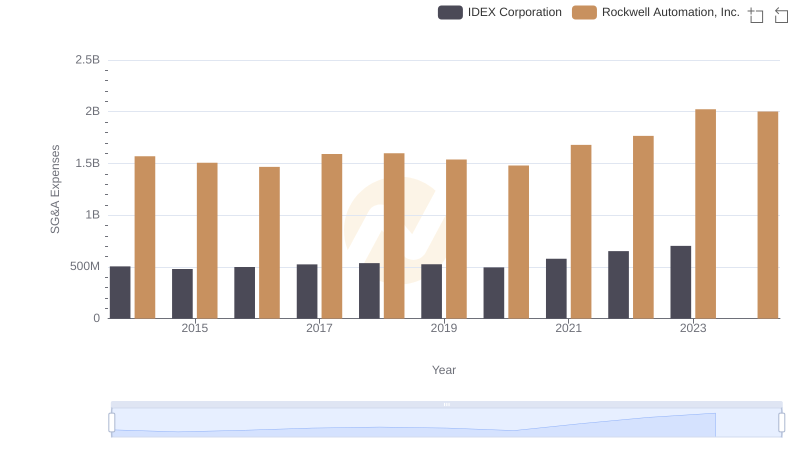
Breaking Down SG&A Expenses: Rockwell Automation, Inc. vs IDEX Corporation
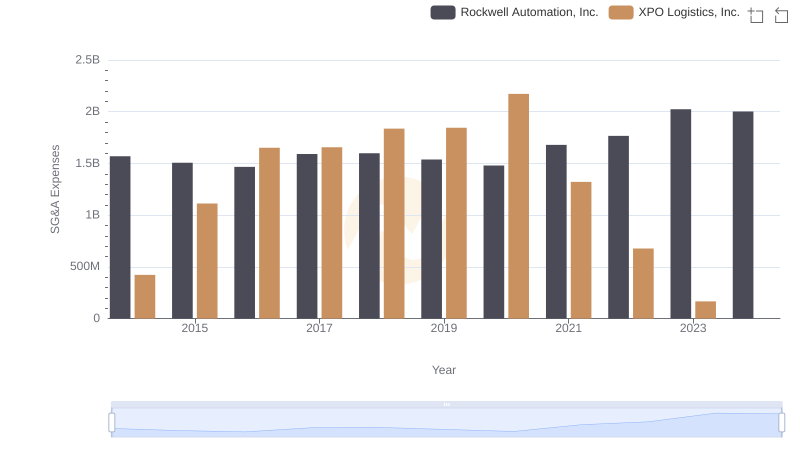
Rockwell Automation, Inc. or XPO Logistics, Inc.: Who Manages SG&A Costs Better?

Cost Management Insights: SG&A Expenses for Rockwell Automation, Inc. and Expeditors International of Washington, Inc.
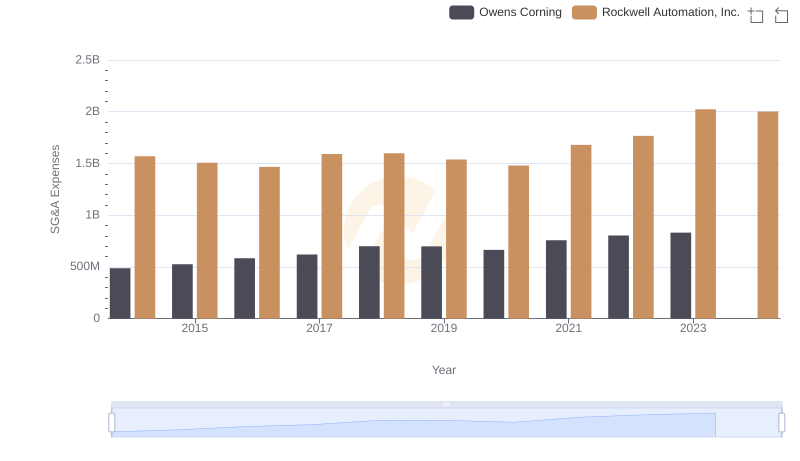
Operational Costs Compared: SG&A Analysis of Rockwell Automation, Inc. and Owens Corning
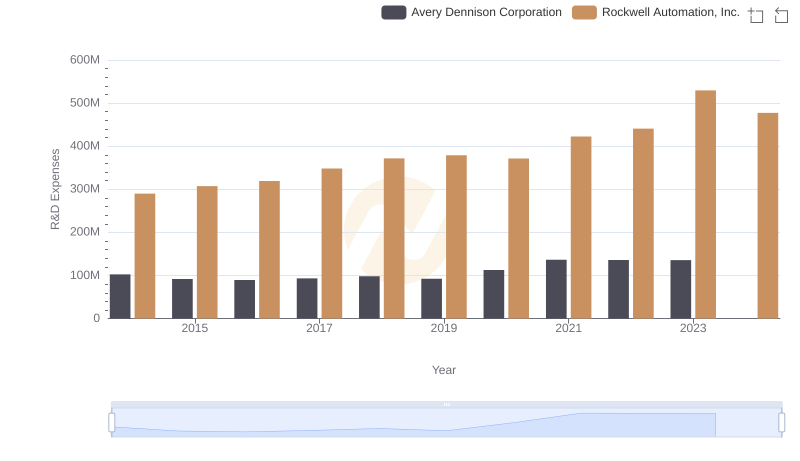
R&D Insights: How Rockwell Automation, Inc. and Avery Dennison Corporation Allocate Funds
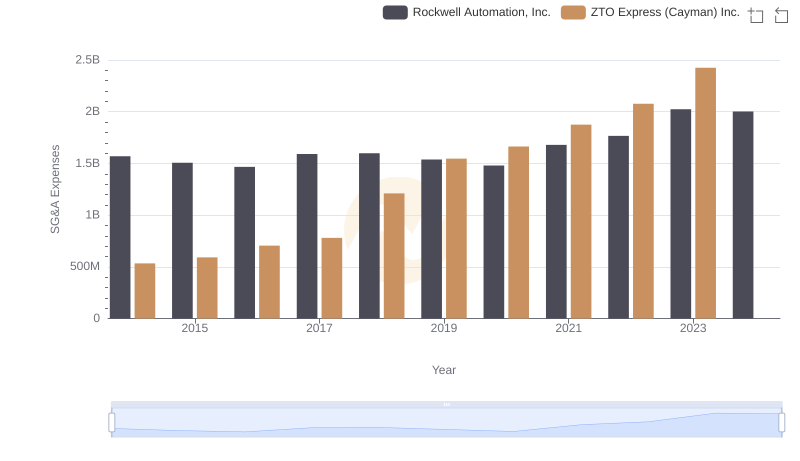
Who Optimizes SG&A Costs Better? Rockwell Automation, Inc. or ZTO Express (Cayman) Inc.
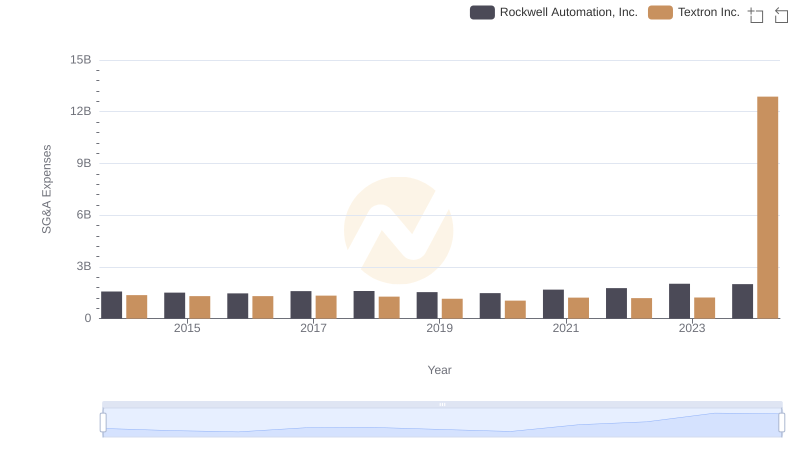
Rockwell Automation, Inc. vs Textron Inc.: SG&A Expense Trends
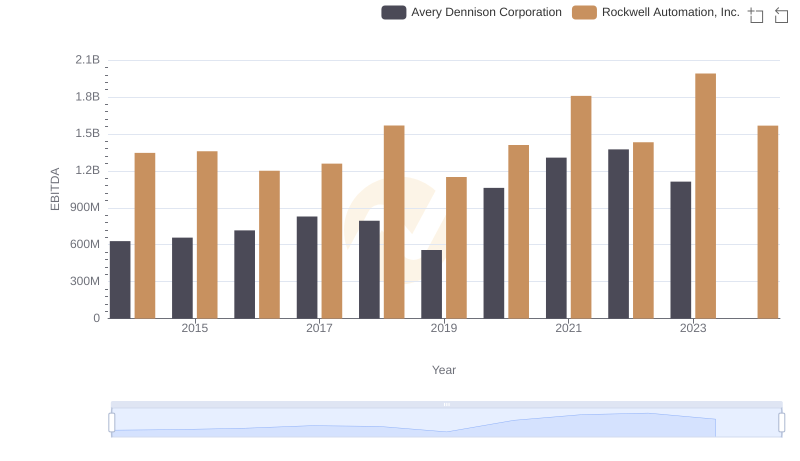
EBITDA Analysis: Evaluating Rockwell Automation, Inc. Against Avery Dennison Corporation