| __timestamp | Avery Dennison Corporation | Rockwell Automation, Inc. |
|---|---|---|
| Wednesday, January 1, 2014 | 4679100000 | 3869600000 |
| Thursday, January 1, 2015 | 4321100000 | 3604800000 |
| Friday, January 1, 2016 | 4386800000 | 3404000000 |
| Sunday, January 1, 2017 | 4801600000 | 3687100000 |
| Monday, January 1, 2018 | 5243500000 | 3793800000 |
| Tuesday, January 1, 2019 | 5166000000 | 3794700000 |
| Wednesday, January 1, 2020 | 5048200000 | 3734600000 |
| Friday, January 1, 2021 | 6095500000 | 4099700000 |
| Saturday, January 1, 2022 | 6635100000 | 4658400000 |
| Sunday, January 1, 2023 | 6086800000 | 5341000000 |
| Monday, January 1, 2024 | 6225000000 | 5070800000 |
Cracking the code
In the ever-evolving landscape of industrial automation and labeling solutions, understanding cost dynamics is crucial. From 2014 to 2023, Rockwell Automation, Inc. and Avery Dennison Corporation have shown distinct trends in their cost of revenue. Avery Dennison's cost of revenue has seen a steady increase, peaking in 2022 with a 54% rise from its 2015 low. Meanwhile, Rockwell Automation experienced a more moderate growth, with a notable 48% increase from 2016 to 2023. The data reveals a missing value for Avery Dennison in 2024, indicating potential data collection gaps or strategic shifts. These insights provide a window into the operational efficiencies and market strategies of these industry giants, offering valuable lessons for investors and industry analysts alike.
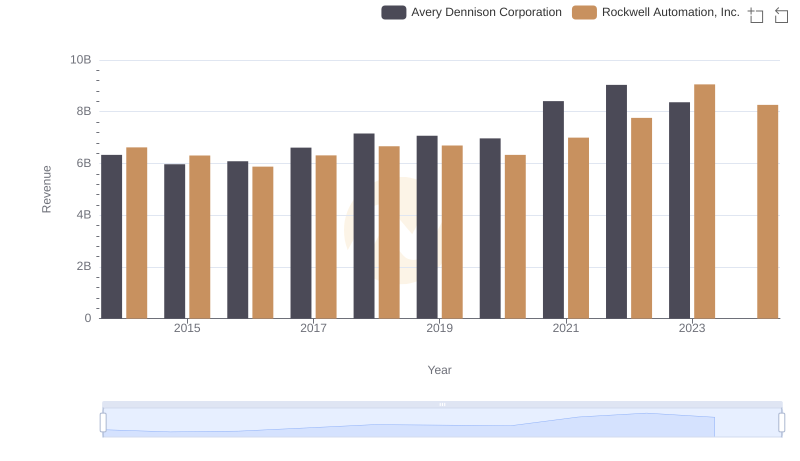
Rockwell Automation, Inc. or Avery Dennison Corporation: Who Leads in Yearly Revenue?
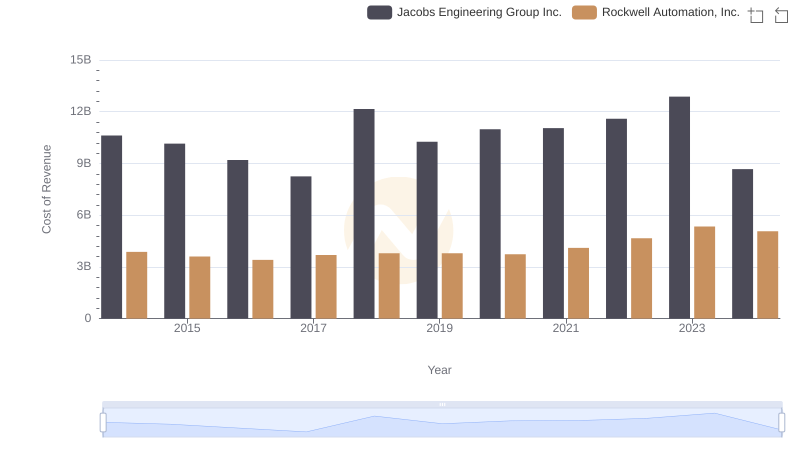
Cost of Revenue: Key Insights for Rockwell Automation, Inc. and Jacobs Engineering Group Inc.
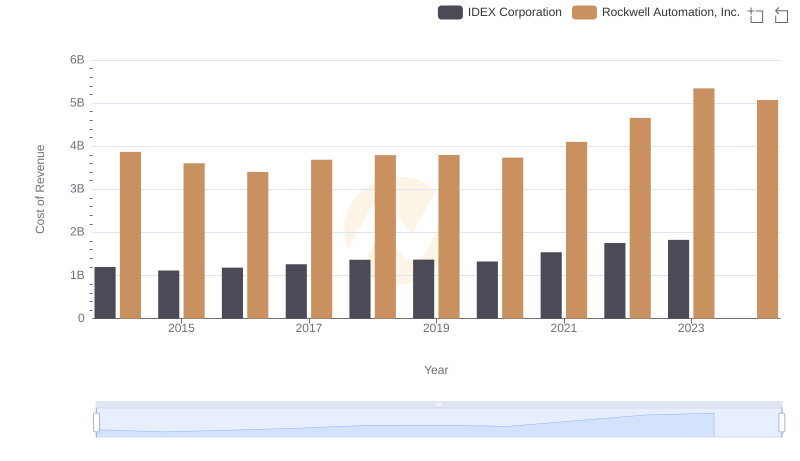
Cost Insights: Breaking Down Rockwell Automation, Inc. and IDEX Corporation's Expenses
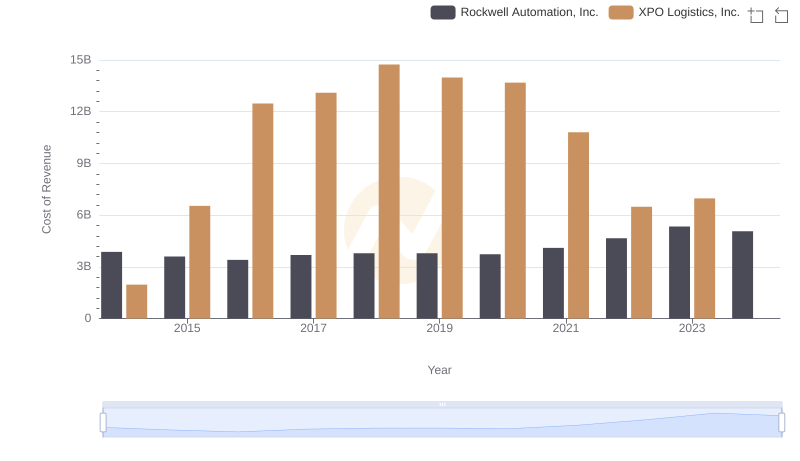
Cost of Revenue: Key Insights for Rockwell Automation, Inc. and XPO Logistics, Inc.
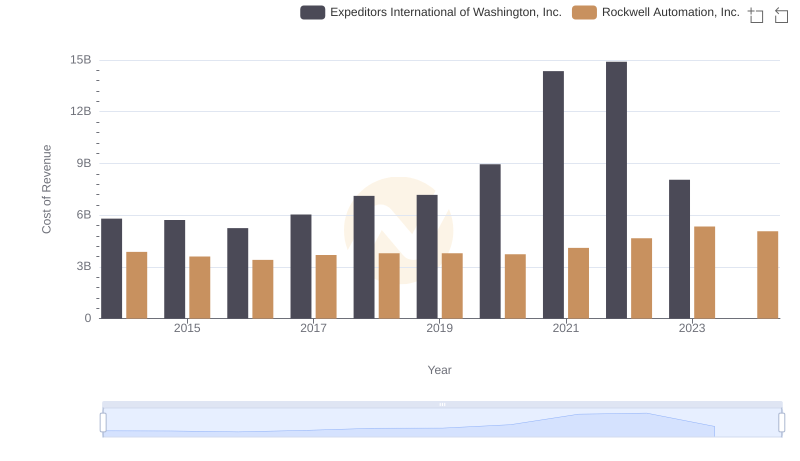
Analyzing Cost of Revenue: Rockwell Automation, Inc. and Expeditors International of Washington, Inc.
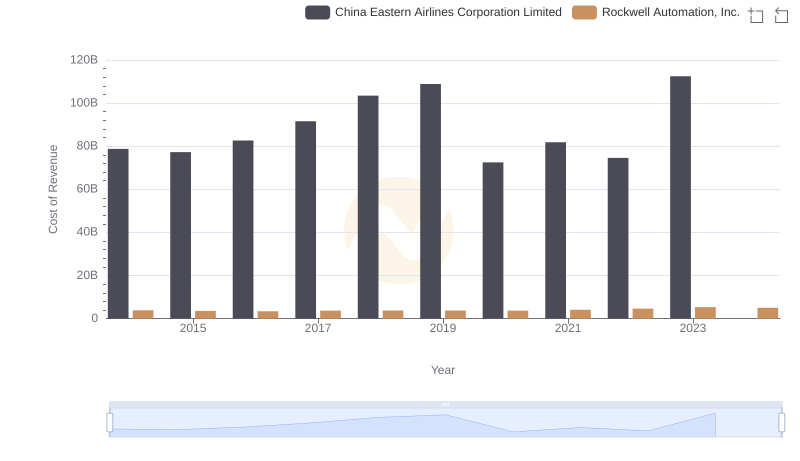
Cost of Revenue: Key Insights for Rockwell Automation, Inc. and China Eastern Airlines Corporation Limited
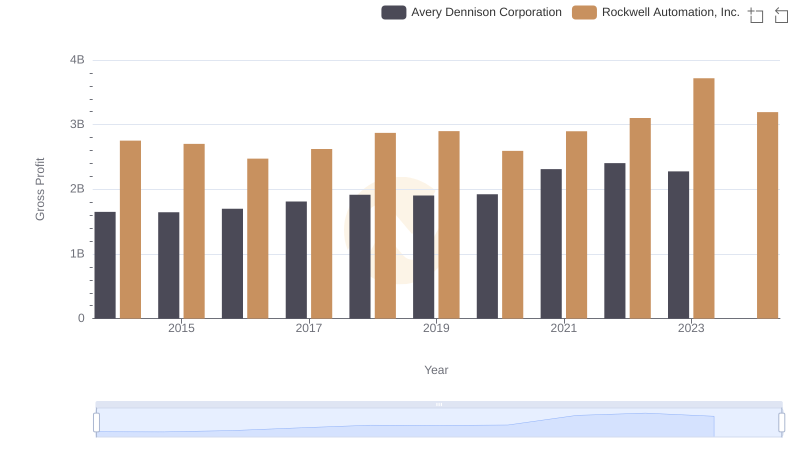
Gross Profit Trends Compared: Rockwell Automation, Inc. vs Avery Dennison Corporation
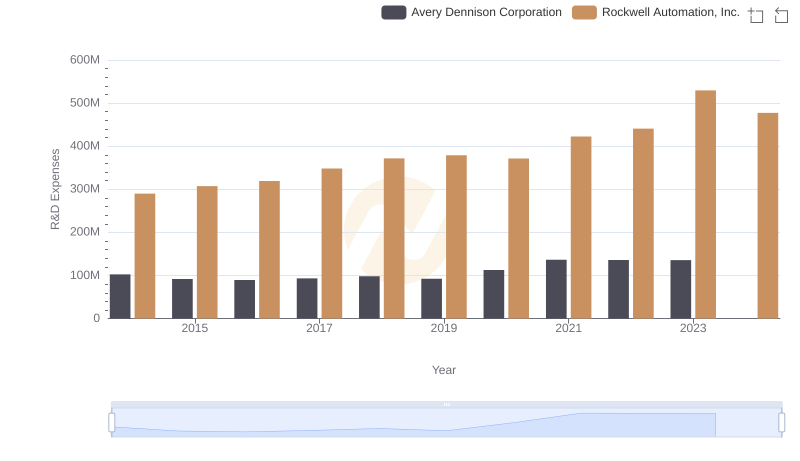
R&D Insights: How Rockwell Automation, Inc. and Avery Dennison Corporation Allocate Funds
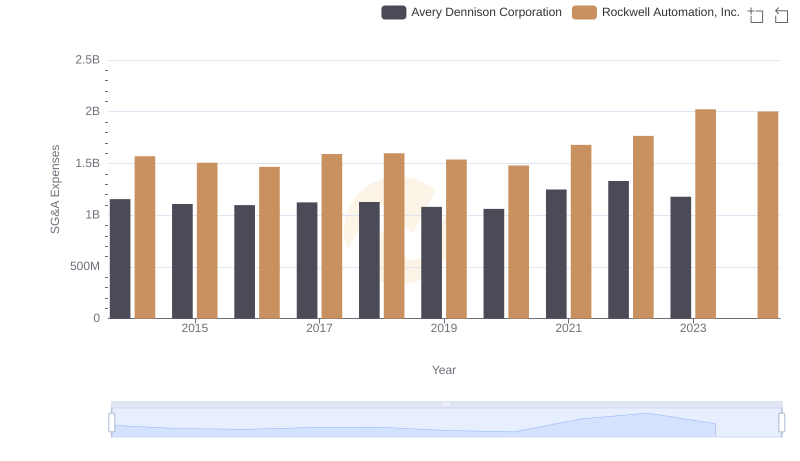
Comparing SG&A Expenses: Rockwell Automation, Inc. vs Avery Dennison Corporation Trends and Insights
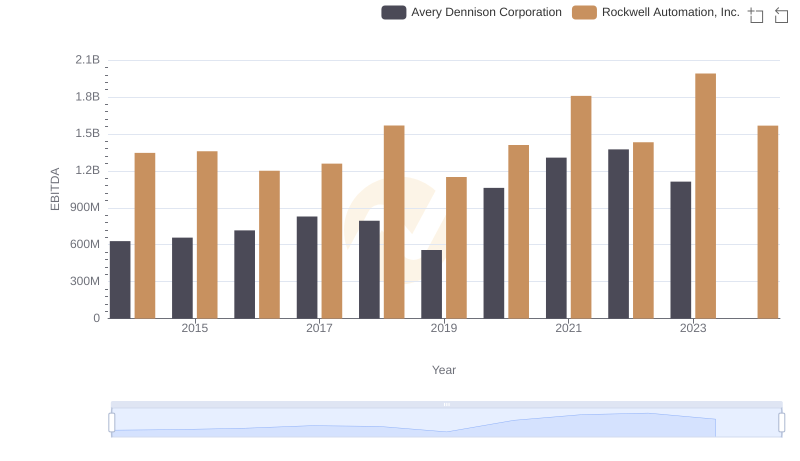
EBITDA Analysis: Evaluating Rockwell Automation, Inc. Against Avery Dennison Corporation