| __timestamp | IDEX Corporation | Rockwell Automation, Inc. |
|---|---|---|
| Wednesday, January 1, 2014 | 504419000 | 1570100000 |
| Thursday, January 1, 2015 | 479408000 | 1506400000 |
| Friday, January 1, 2016 | 498994000 | 1467400000 |
| Sunday, January 1, 2017 | 524940000 | 1591500000 |
| Monday, January 1, 2018 | 536724000 | 1599000000 |
| Tuesday, January 1, 2019 | 524987000 | 1538500000 |
| Wednesday, January 1, 2020 | 494935000 | 1479800000 |
| Friday, January 1, 2021 | 578200000 | 1680000000 |
| Saturday, January 1, 2022 | 652700000 | 1766700000 |
| Sunday, January 1, 2023 | 703500000 | 2023700000 |
| Monday, January 1, 2024 | 758700000 | 2002600000 |
Cracking the code
In the ever-evolving landscape of industrial automation, understanding the financial dynamics of key players is crucial. Rockwell Automation, Inc. and IDEX Corporation, two giants in the industry, have shown distinct trends in their Selling, General, and Administrative (SG&A) expenses over the past decade. From 2014 to 2023, Rockwell Automation's SG&A expenses have consistently been higher, peaking at approximately $2 billion in 2023, marking a 29% increase from 2014. In contrast, IDEX Corporation's expenses grew by 39% over the same period, reaching around $703 million in 2023. This divergence highlights Rockwell's larger scale of operations and possibly more extensive market reach. However, the missing data for IDEX in 2024 suggests a need for cautious interpretation. As these companies continue to innovate, monitoring their financial strategies will provide valuable insights into their competitive positioning.
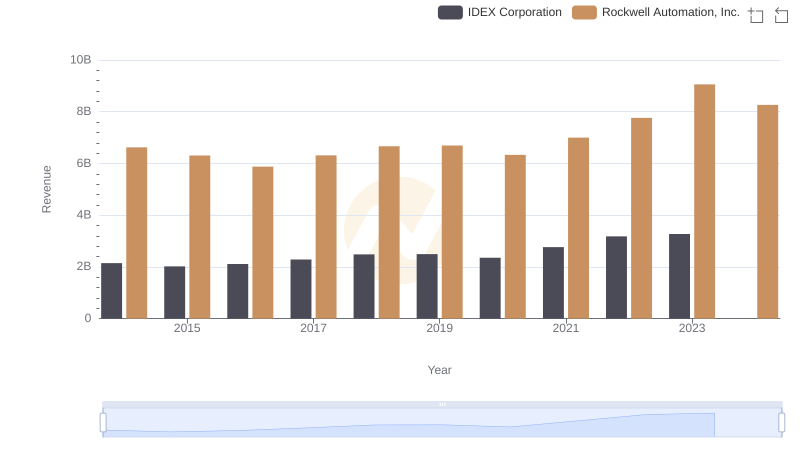
Comparing Revenue Performance: Rockwell Automation, Inc. or IDEX Corporation?
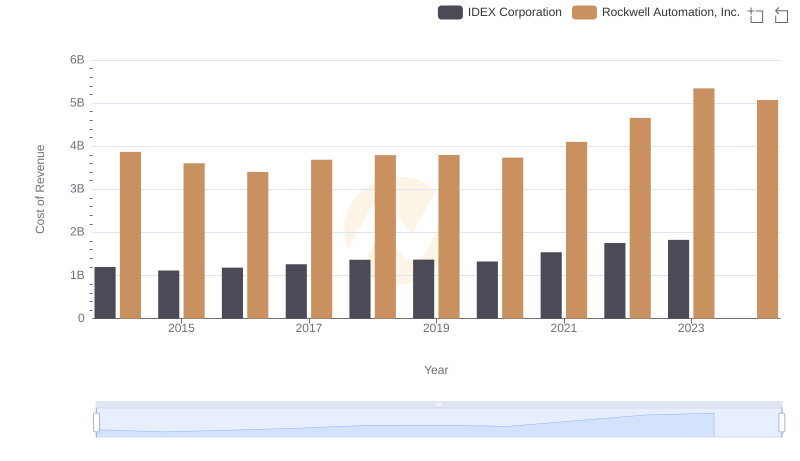
Cost Insights: Breaking Down Rockwell Automation, Inc. and IDEX Corporation's Expenses
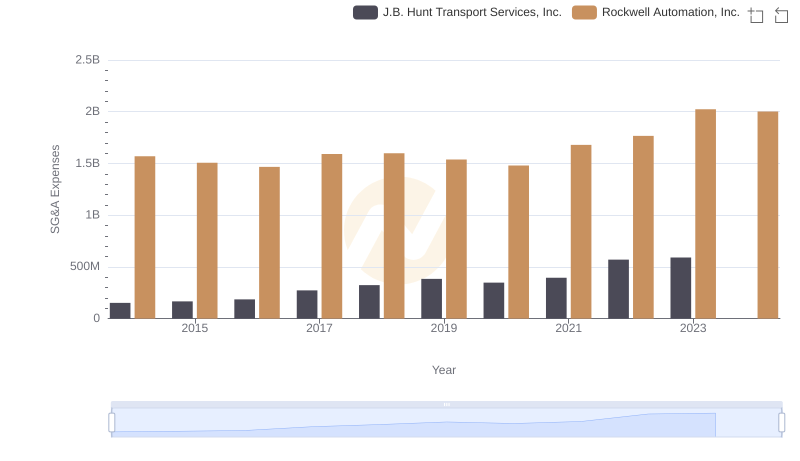
Breaking Down SG&A Expenses: Rockwell Automation, Inc. vs J.B. Hunt Transport Services, Inc.
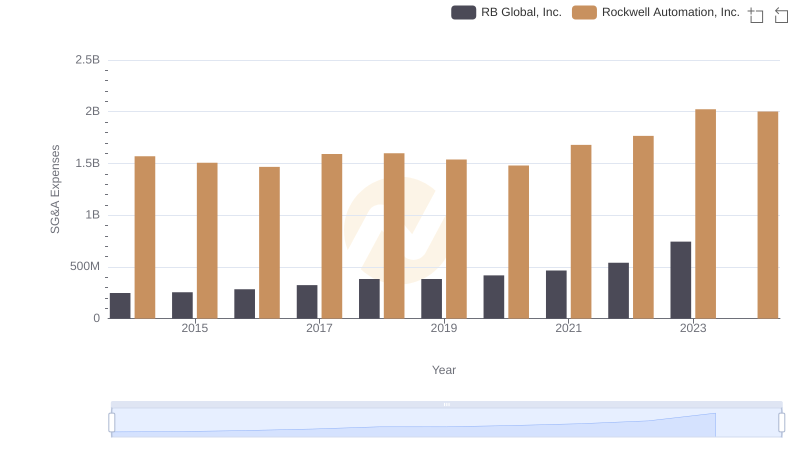
SG&A Efficiency Analysis: Comparing Rockwell Automation, Inc. and RB Global, Inc.
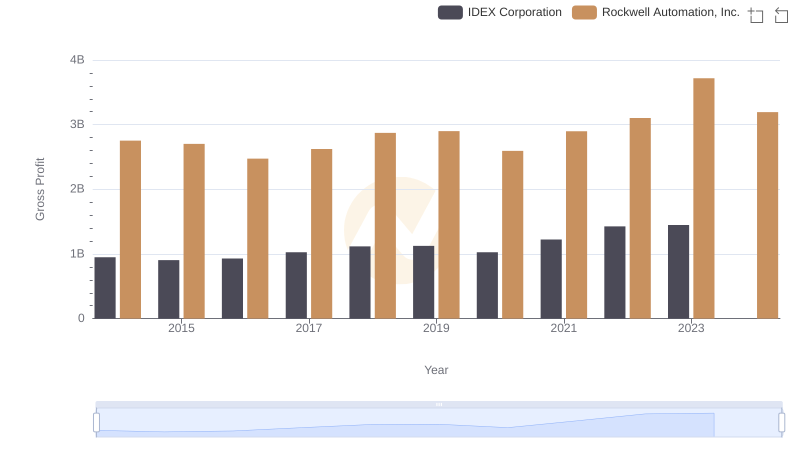
Rockwell Automation, Inc. and IDEX Corporation: A Detailed Gross Profit Analysis
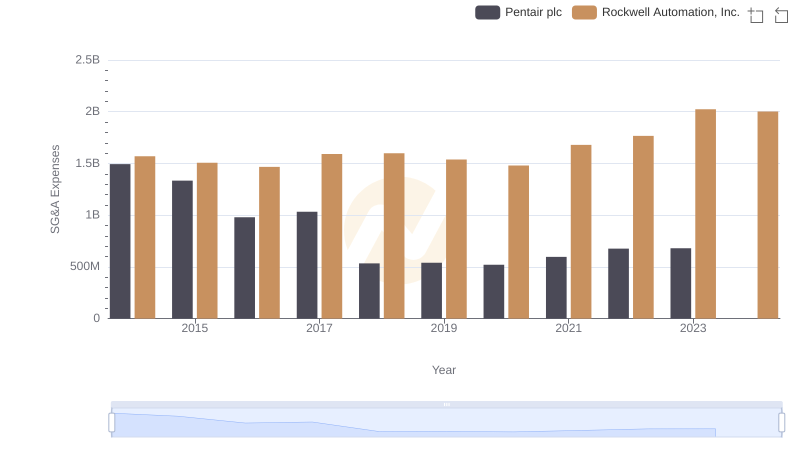
Rockwell Automation, Inc. vs Pentair plc: SG&A Expense Trends
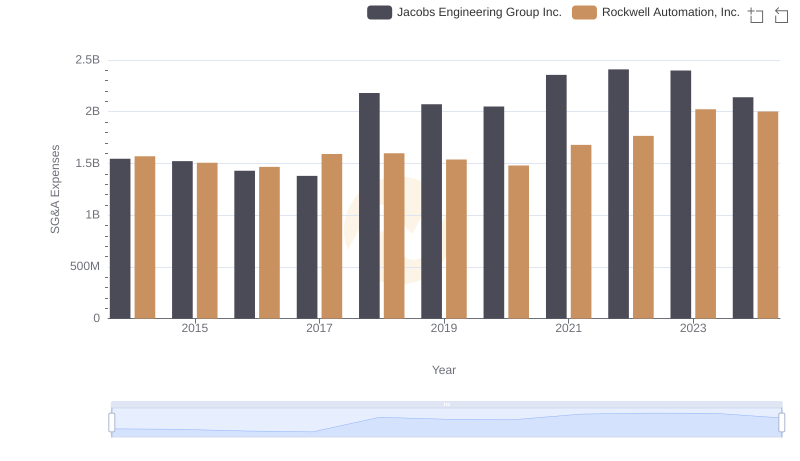
Rockwell Automation, Inc. vs Jacobs Engineering Group Inc.: SG&A Expense Trends
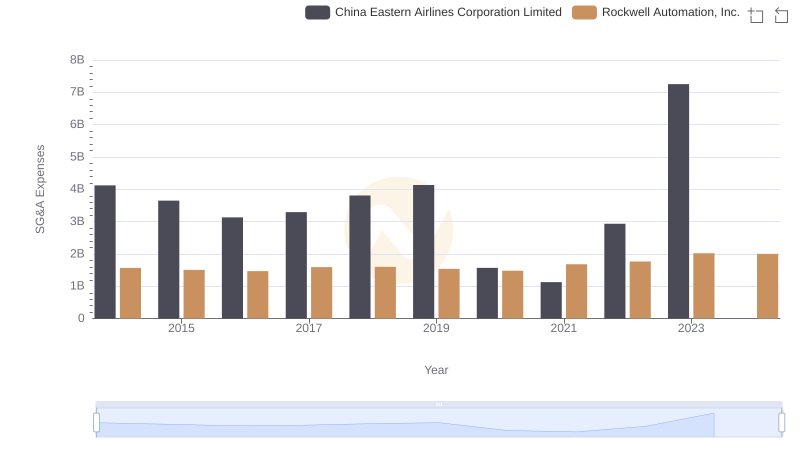
Breaking Down SG&A Expenses: Rockwell Automation, Inc. vs China Eastern Airlines Corporation Limited
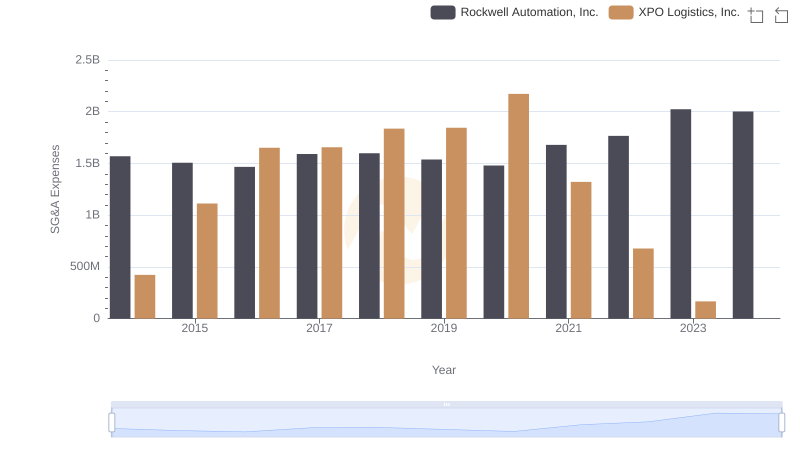
Rockwell Automation, Inc. or XPO Logistics, Inc.: Who Manages SG&A Costs Better?

Cost Management Insights: SG&A Expenses for Rockwell Automation, Inc. and Expeditors International of Washington, Inc.
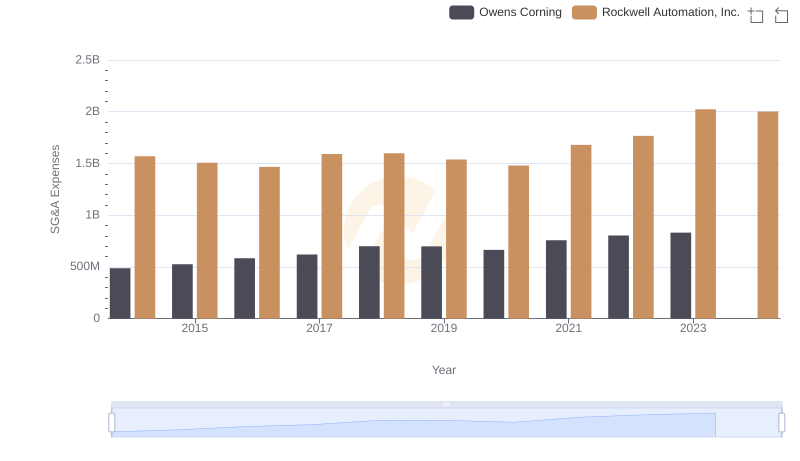
Operational Costs Compared: SG&A Analysis of Rockwell Automation, Inc. and Owens Corning
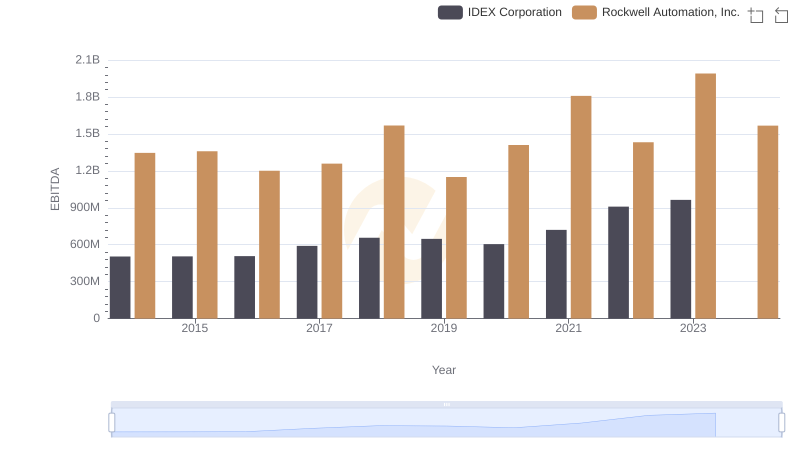
Rockwell Automation, Inc. vs IDEX Corporation: In-Depth EBITDA Performance Comparison