| __timestamp | Avery Dennison Corporation | Rockwell Automation, Inc. |
|---|---|---|
| Wednesday, January 1, 2014 | 1651200000 | 2753900000 |
| Thursday, January 1, 2015 | 1645800000 | 2703100000 |
| Friday, January 1, 2016 | 1699700000 | 2475500000 |
| Sunday, January 1, 2017 | 1812200000 | 2624200000 |
| Monday, January 1, 2018 | 1915500000 | 2872200000 |
| Tuesday, January 1, 2019 | 1904100000 | 2900100000 |
| Wednesday, January 1, 2020 | 1923300000 | 2595200000 |
| Friday, January 1, 2021 | 2312800000 | 2897700000 |
| Saturday, January 1, 2022 | 2404200000 | 3102000000 |
| Sunday, January 1, 2023 | 2277499999 | 3717000000 |
| Monday, January 1, 2024 | 2530700000 | 3193400000 |
In pursuit of knowledge
In the competitive landscape of industrial automation and labeling solutions, Rockwell Automation, Inc. and Avery Dennison Corporation have showcased intriguing gross profit trends over the past decade. From 2014 to 2023, Rockwell Automation consistently outperformed Avery Dennison, with a notable peak in 2023, achieving a gross profit of approximately $3.7 billion. This represents a remarkable 35% increase from its 2016 low. Meanwhile, Avery Dennison experienced a steady climb, peaking in 2022 with a gross profit of around $2.4 billion, marking a 46% rise from its 2015 figures. However, 2023 saw a slight dip for Avery Dennison, highlighting potential market challenges. These trends underscore the dynamic nature of the industry, where innovation and strategic positioning are key to maintaining profitability. Missing data for 2024 suggests an evolving landscape, inviting speculation on future trajectories.
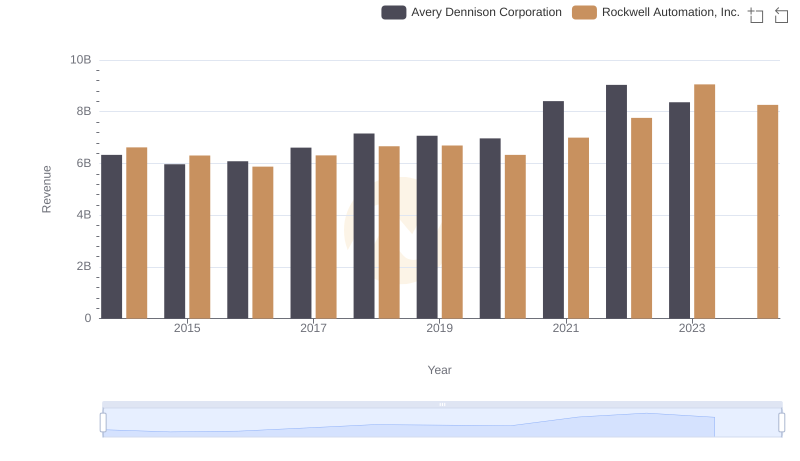
Rockwell Automation, Inc. or Avery Dennison Corporation: Who Leads in Yearly Revenue?
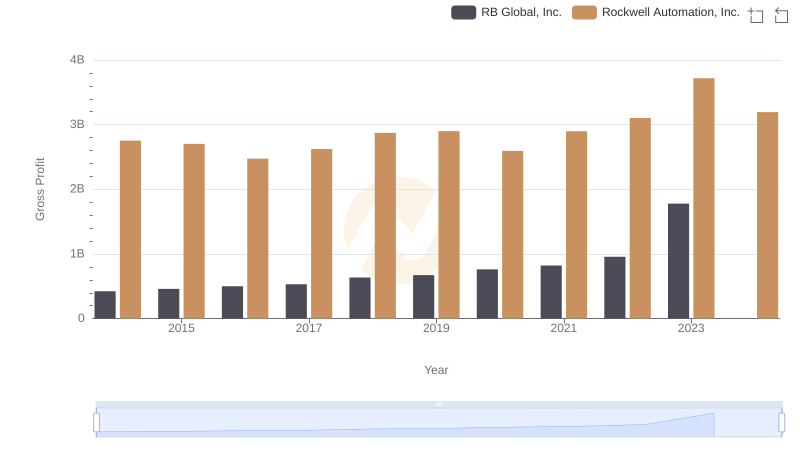
Gross Profit Trends Compared: Rockwell Automation, Inc. vs RB Global, Inc.
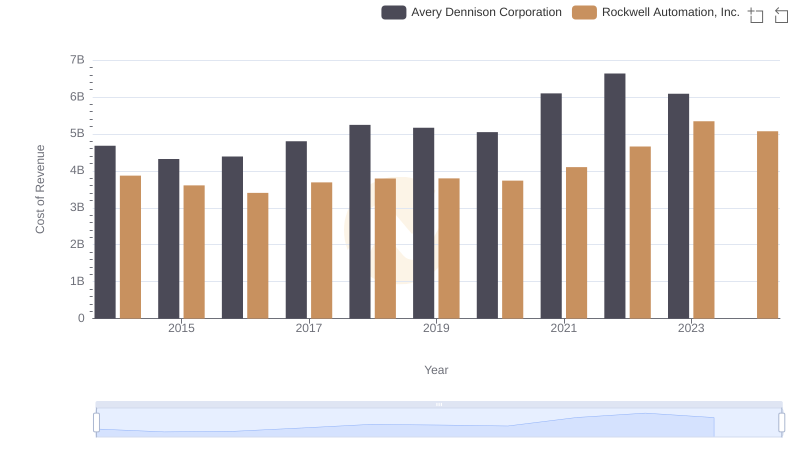
Analyzing Cost of Revenue: Rockwell Automation, Inc. and Avery Dennison Corporation
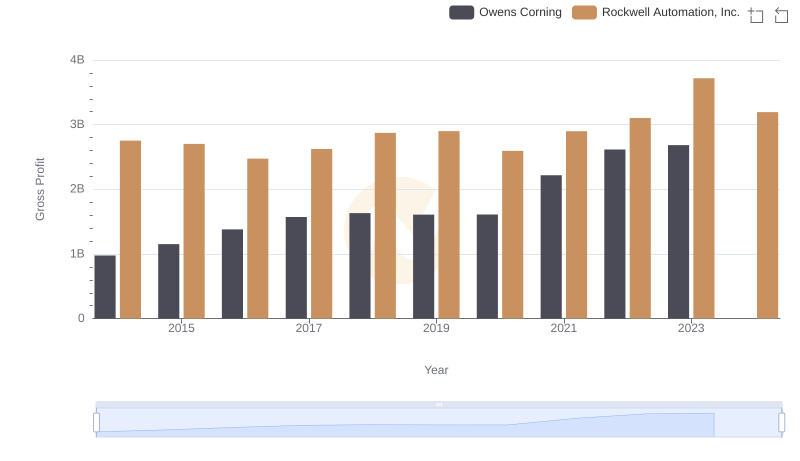
Gross Profit Trends Compared: Rockwell Automation, Inc. vs Owens Corning
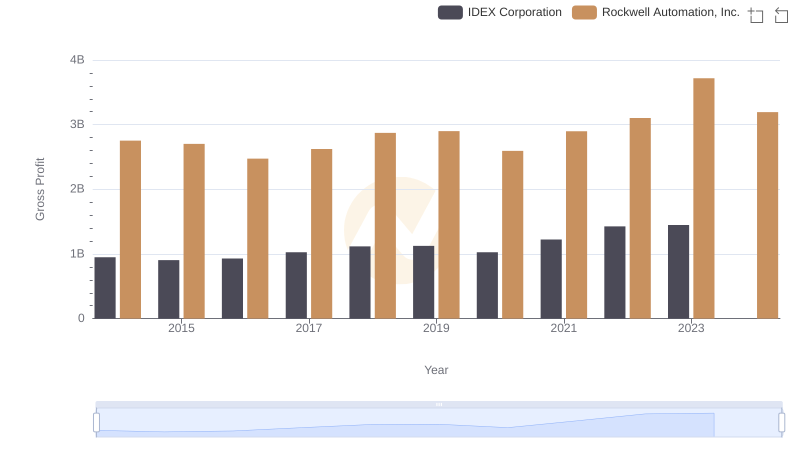
Rockwell Automation, Inc. and IDEX Corporation: A Detailed Gross Profit Analysis

Gross Profit Comparison: Rockwell Automation, Inc. and Expeditors International of Washington, Inc. Trends
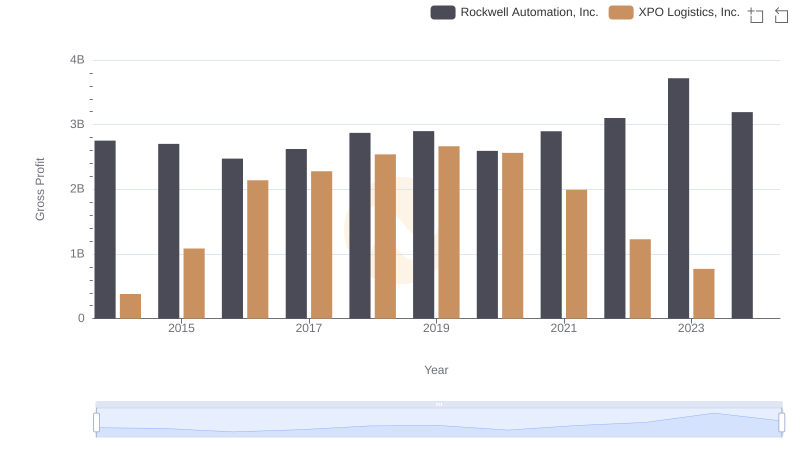
Gross Profit Trends Compared: Rockwell Automation, Inc. vs XPO Logistics, Inc.
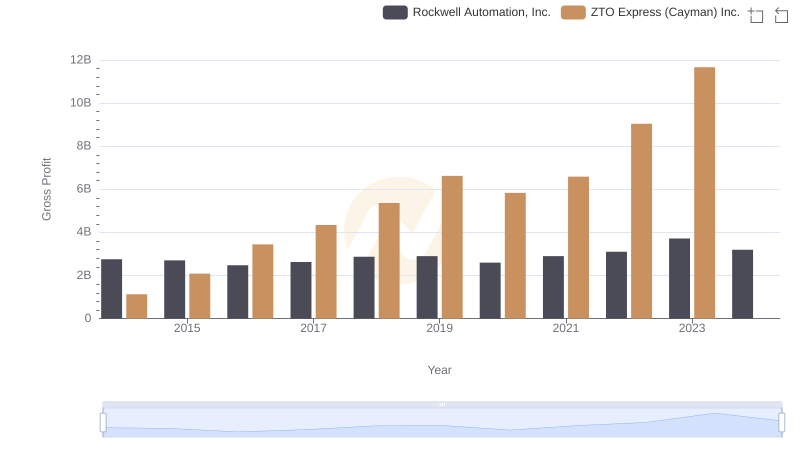
Key Insights on Gross Profit: Rockwell Automation, Inc. vs ZTO Express (Cayman) Inc.
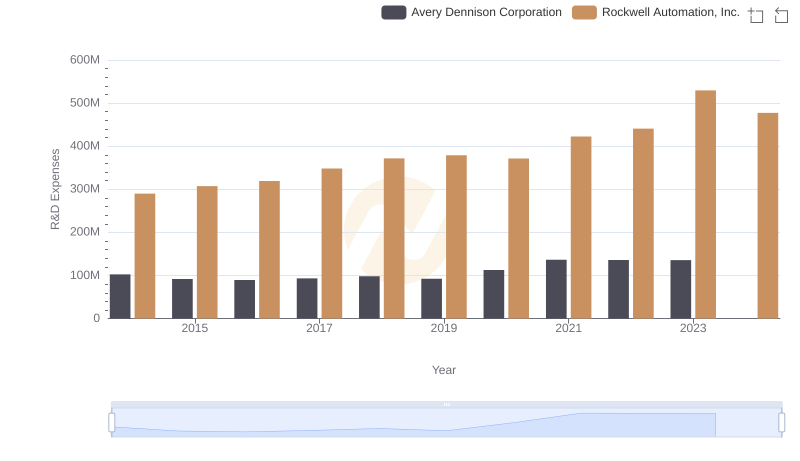
R&D Insights: How Rockwell Automation, Inc. and Avery Dennison Corporation Allocate Funds
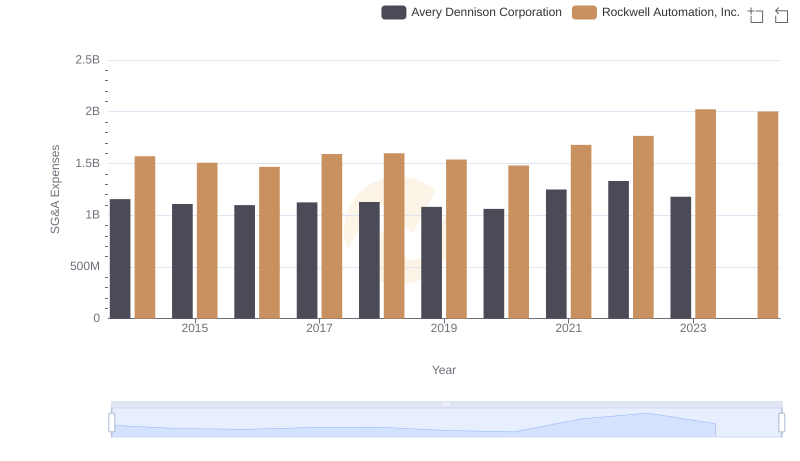
Comparing SG&A Expenses: Rockwell Automation, Inc. vs Avery Dennison Corporation Trends and Insights
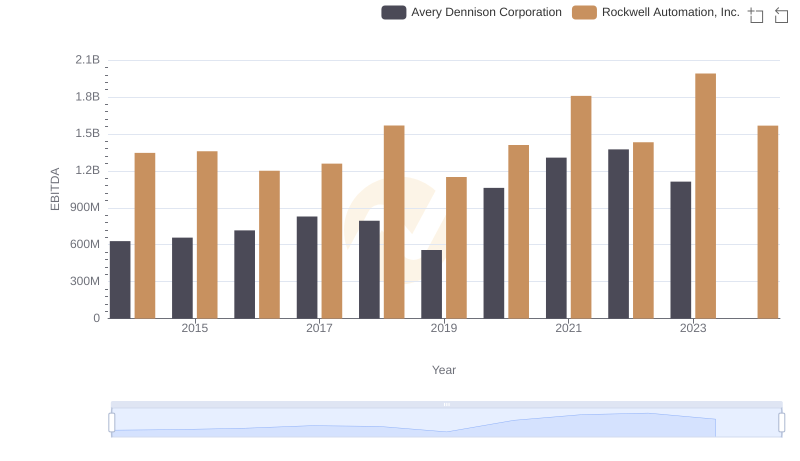
EBITDA Analysis: Evaluating Rockwell Automation, Inc. Against Avery Dennison Corporation