| __timestamp | Fortinet, Inc. | Intuit Inc. |
|---|---|---|
| Wednesday, January 1, 2014 | 357151000 | 1762000000 |
| Thursday, January 1, 2015 | 541885000 | 1771000000 |
| Friday, January 1, 2016 | 707581000 | 1807000000 |
| Sunday, January 1, 2017 | 788888000 | 1973000000 |
| Monday, January 1, 2018 | 875300000 | 2298000000 |
| Tuesday, January 1, 2019 | 1029000000 | 2524000000 |
| Wednesday, January 1, 2020 | 1191400000 | 2727000000 |
| Friday, January 1, 2021 | 1489200000 | 3626000000 |
| Saturday, January 1, 2022 | 1855100000 | 4986000000 |
| Sunday, January 1, 2023 | 2217300000 | 5062000000 |
| Monday, January 1, 2024 | 2282600000 | 5730000000 |
Igniting the spark of knowledge
In the ever-evolving landscape of technology, understanding a company's operational efficiency is crucial. Selling, General, and Administrative (SG&A) expenses offer a window into this efficiency. Over the past decade, Intuit Inc. and Fortinet, Inc. have showcased contrasting trajectories in their SG&A expenditures.
From 2014 to 2023, Intuit's SG&A expenses have surged by approximately 187%, reflecting its strategic investments in growth and innovation. By 2023, Intuit's SG&A expenses reached a peak, underscoring its commitment to expanding its market footprint.
Fortinet, on the other hand, has experienced a remarkable 521% increase in SG&A expenses over the same period. This rapid growth highlights Fortinet's aggressive expansion strategy in the cybersecurity domain.
While both companies have shown significant growth, the data for 2024 remains incomplete, leaving room for speculation on future trends.
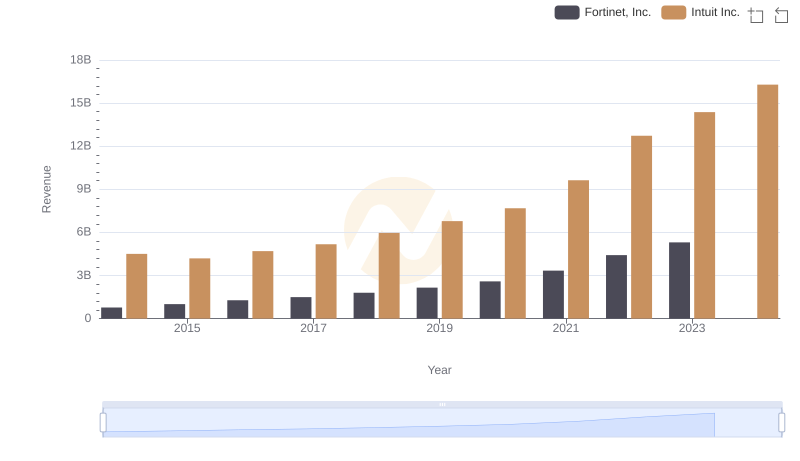
Intuit Inc. or Fortinet, Inc.: Who Leads in Yearly Revenue?
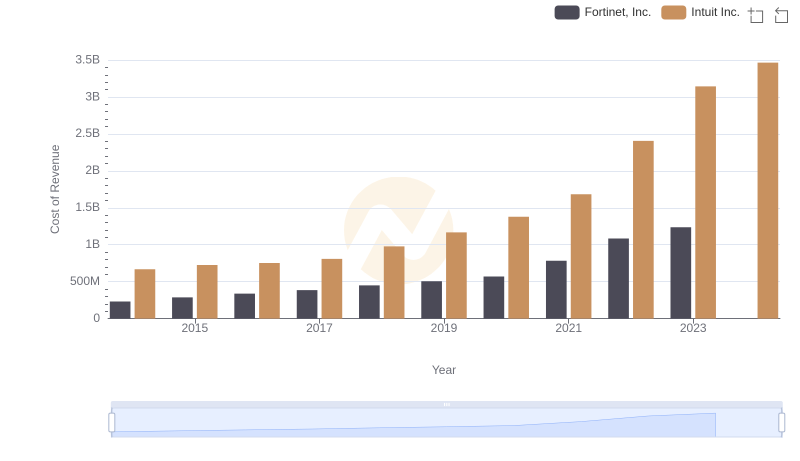
Comparing Cost of Revenue Efficiency: Intuit Inc. vs Fortinet, Inc.
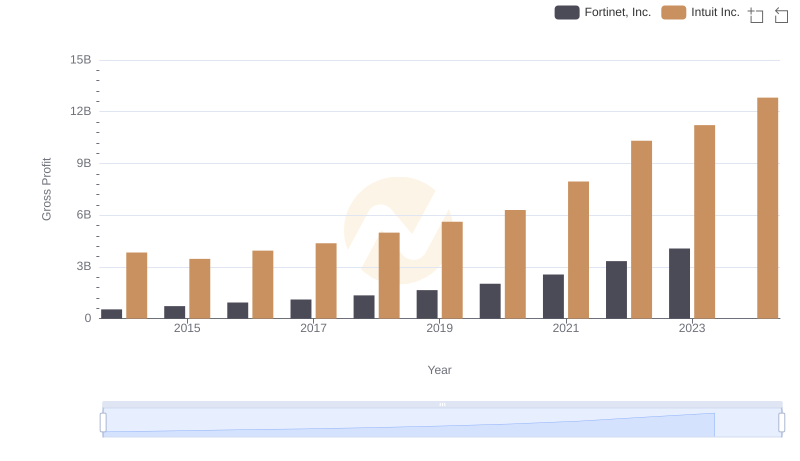
Intuit Inc. vs Fortinet, Inc.: A Gross Profit Performance Breakdown
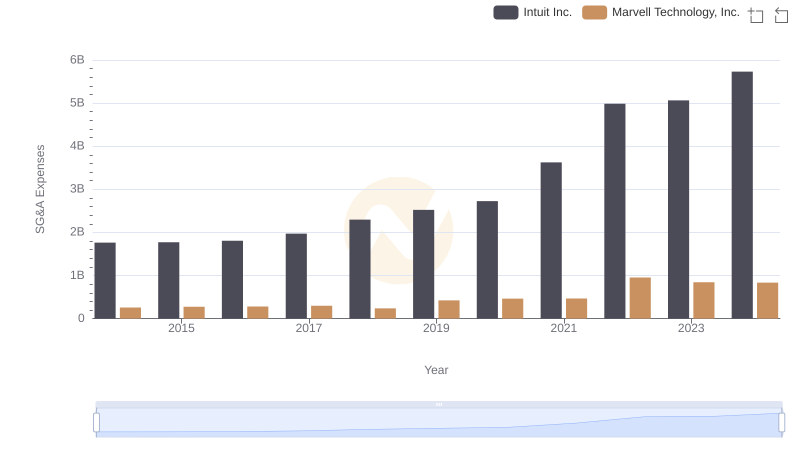
Operational Costs Compared: SG&A Analysis of Intuit Inc. and Marvell Technology, Inc.
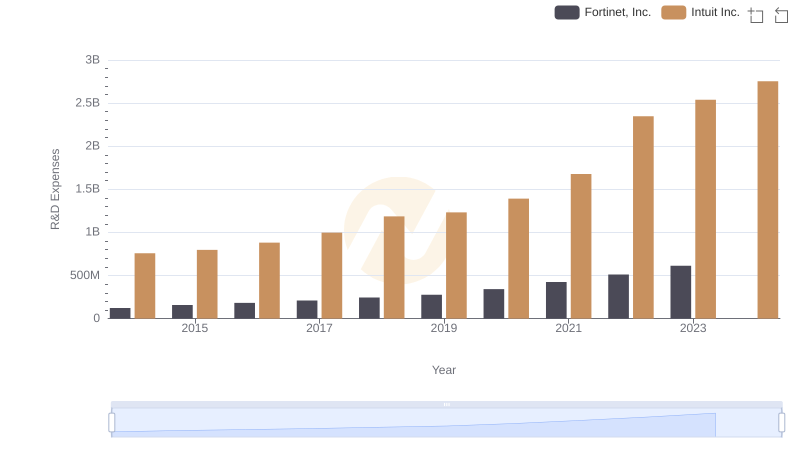
Intuit Inc. vs Fortinet, Inc.: Strategic Focus on R&D Spending
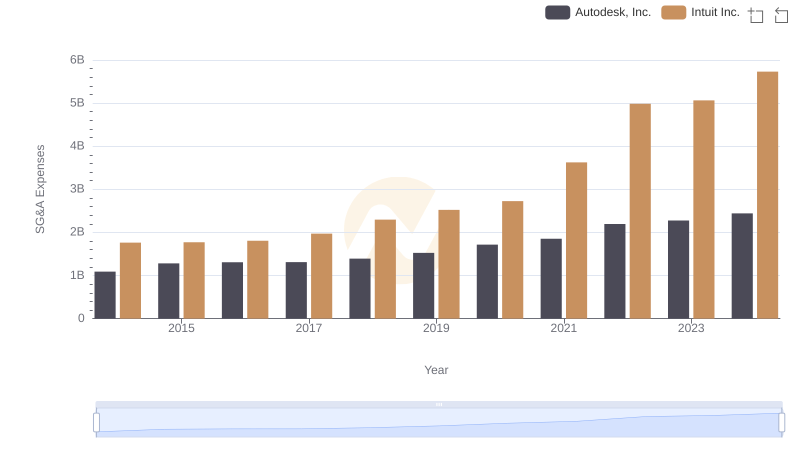
Intuit Inc. vs Autodesk, Inc.: SG&A Expense Trends
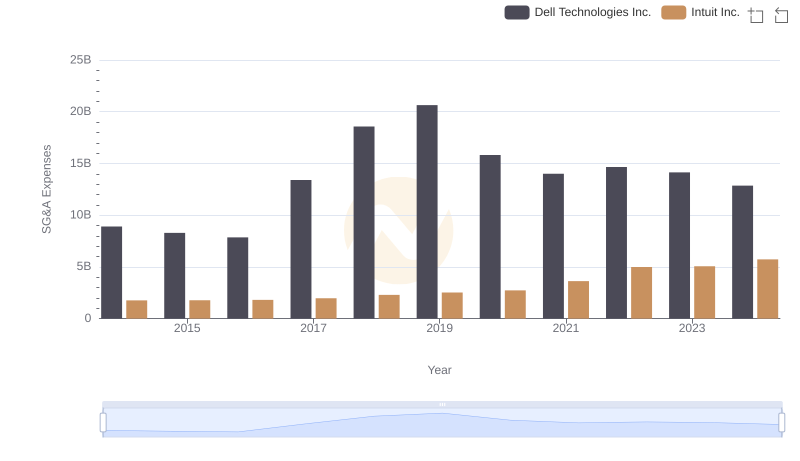
Operational Costs Compared: SG&A Analysis of Intuit Inc. and Dell Technologies Inc.
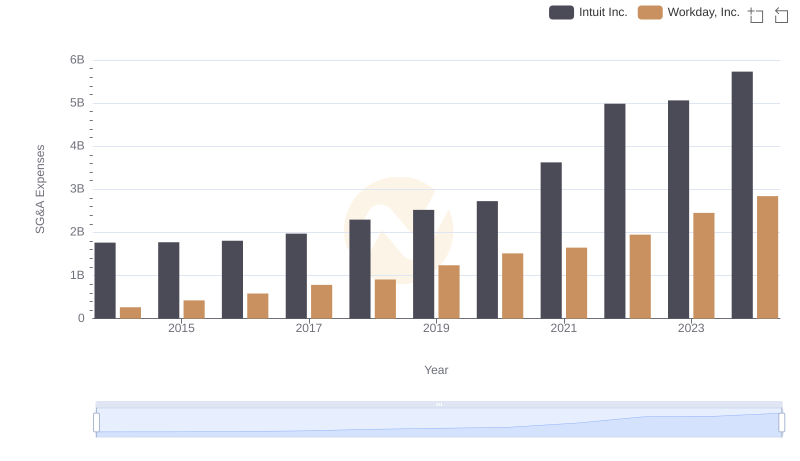
Intuit Inc. and Workday, Inc.: SG&A Spending Patterns Compared
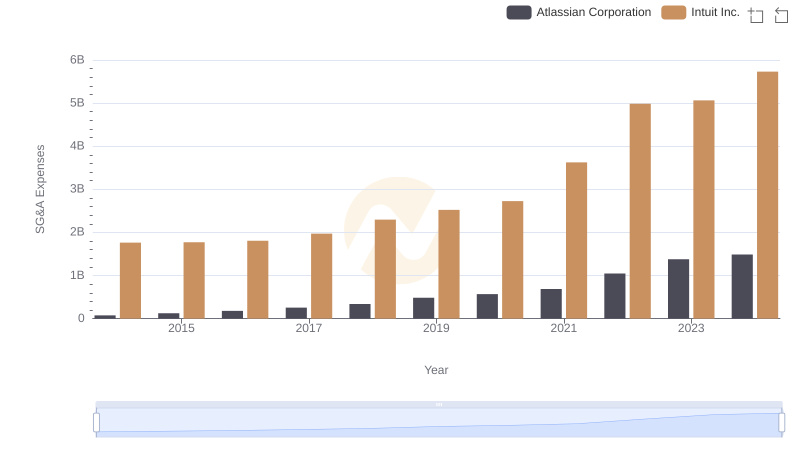
Who Optimizes SG&A Costs Better? Intuit Inc. or Atlassian Corporation
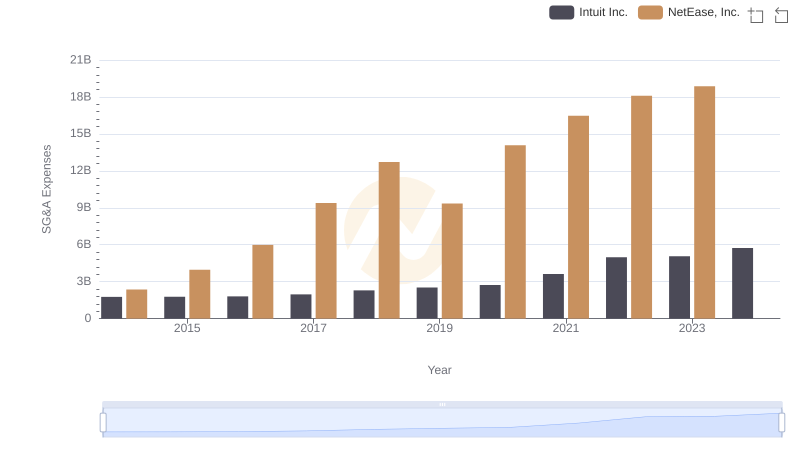
Breaking Down SG&A Expenses: Intuit Inc. vs NetEase, Inc.
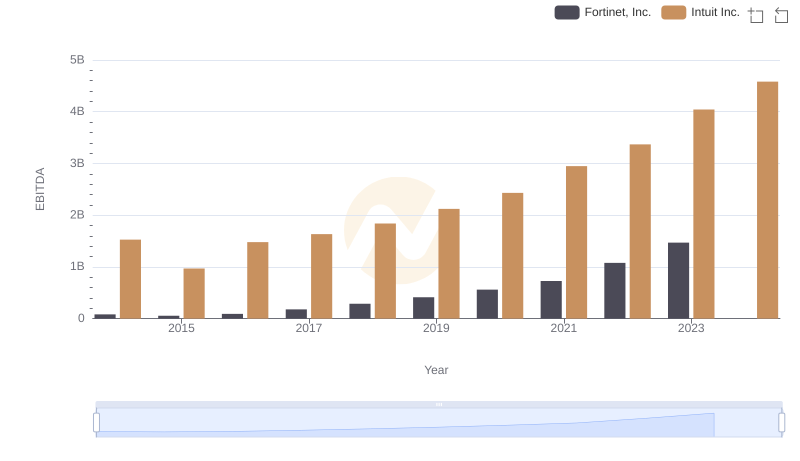
A Professional Review of EBITDA: Intuit Inc. Compared to Fortinet, Inc.
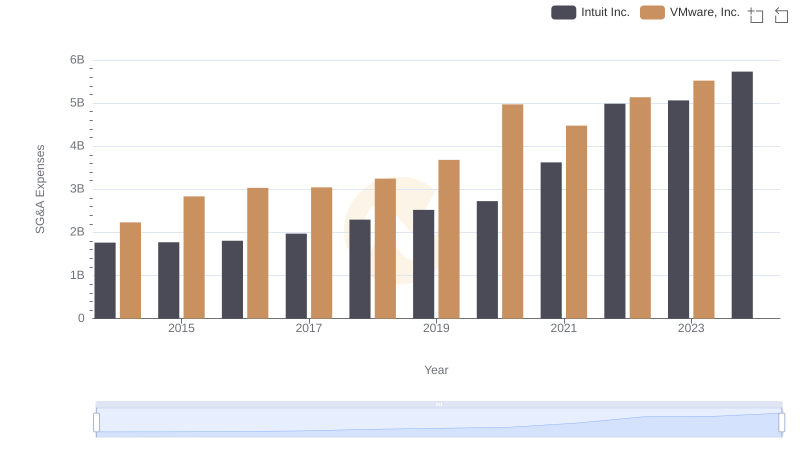
Cost Management Insights: SG&A Expenses for Intuit Inc. and VMware, Inc.