| __timestamp | Corpay, Inc. | Infosys Limited |
|---|---|---|
| Wednesday, January 1, 2014 | 281490000 | 1079000000 |
| Thursday, January 1, 2015 | 406790000 | 1176000000 |
| Friday, January 1, 2016 | 450953000 | 1020000000 |
| Sunday, January 1, 2017 | 603268000 | 1279000000 |
| Monday, January 1, 2018 | 631142000 | 1220000000 |
| Tuesday, January 1, 2019 | 683511000 | 1504000000 |
| Wednesday, January 1, 2020 | 567410000 | 1223000000 |
| Friday, January 1, 2021 | 747948000 | 1391000000 |
| Saturday, January 1, 2022 | 893217000 | 1678000000 |
| Sunday, January 1, 2023 | 943581000 | 1632000000 |
| Monday, January 1, 2024 | 997780000 |
Infusing magic into the data realm
In the ever-evolving landscape of global business, understanding the financial strategies of industry leaders is crucial. This analysis delves into the Selling, General, and Administrative (SG&A) expenses of two prominent companies: Infosys Limited and Corpay, Inc., from 2014 to 2023.
Infosys, a titan in the IT services sector, has consistently increased its SG&A expenses, reflecting a strategic investment in growth and market expansion. From 2014 to 2023, Infosys saw a 51% rise in these expenses, peaking in 2022. This trend underscores Infosys's commitment to maintaining its competitive edge in a rapidly changing industry.
Corpay, Inc., a key player in the financial services domain, exhibited a remarkable 235% surge in SG&A expenses over the same period. This sharp increase highlights Corpay's aggressive approach to scaling operations and capturing market share.
Both companies demonstrate distinct strategies in managing their SG&A expenses, offering valuable insights into their operational priorities and market positioning.
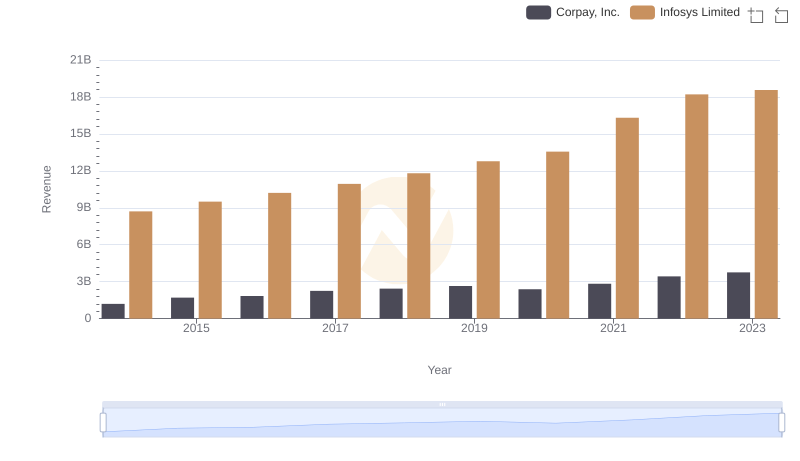
Revenue Showdown: Infosys Limited vs Corpay, Inc.
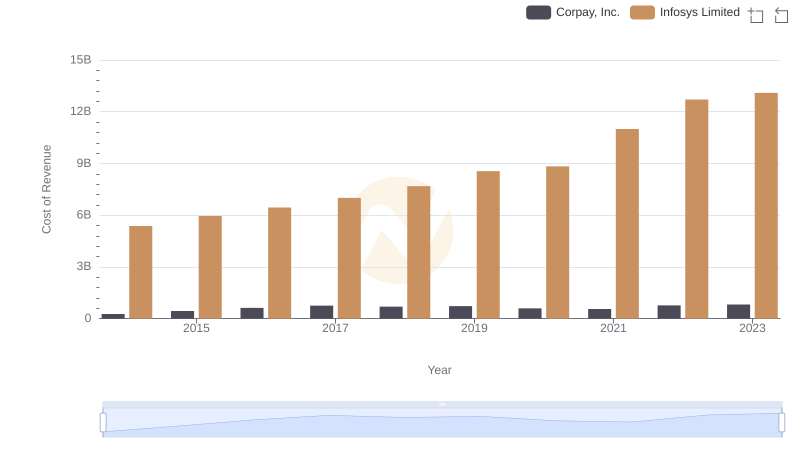
Analyzing Cost of Revenue: Infosys Limited and Corpay, Inc.
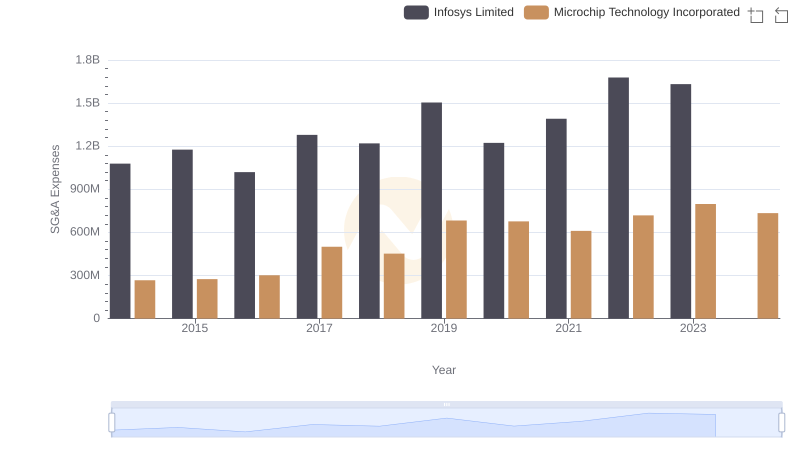
Comparing SG&A Expenses: Infosys Limited vs Microchip Technology Incorporated Trends and Insights
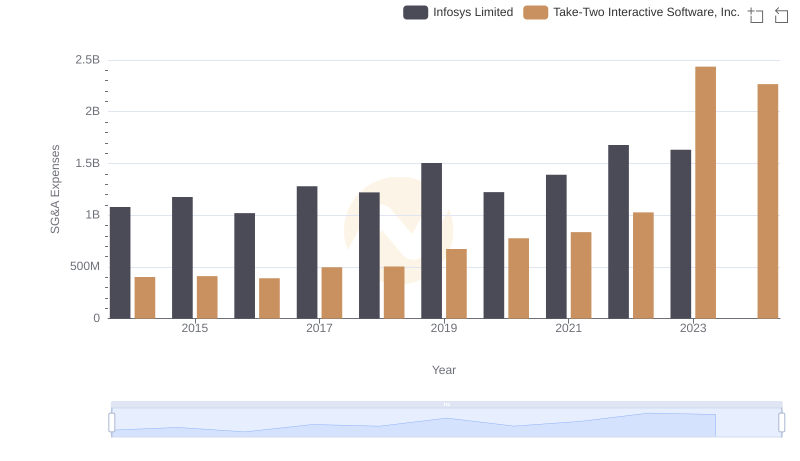
Who Optimizes SG&A Costs Better? Infosys Limited or Take-Two Interactive Software, Inc.
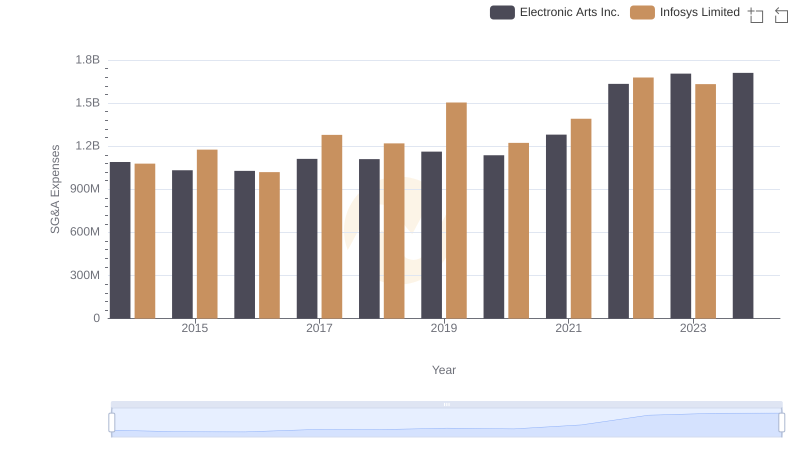
Infosys Limited or Electronic Arts Inc.: Who Manages SG&A Costs Better?
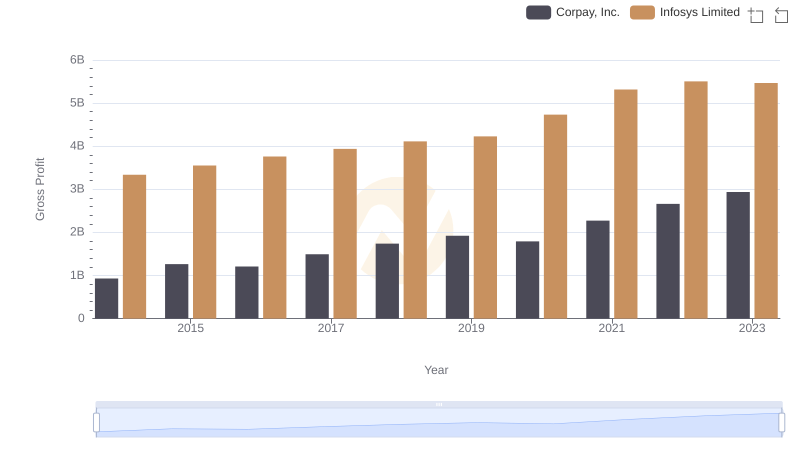
Gross Profit Analysis: Comparing Infosys Limited and Corpay, Inc.
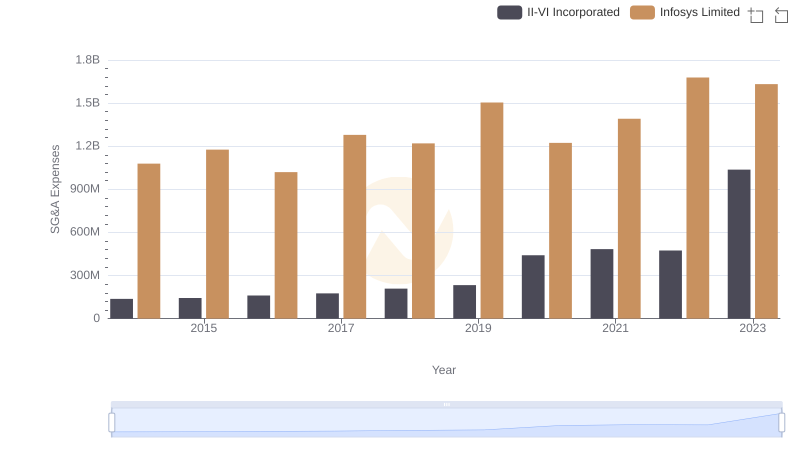
Cost Management Insights: SG&A Expenses for Infosys Limited and II-VI Incorporated
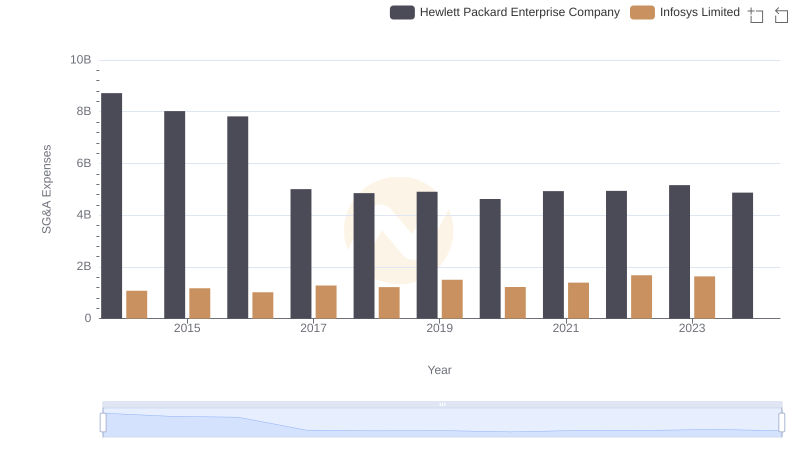
Who Optimizes SG&A Costs Better? Infosys Limited or Hewlett Packard Enterprise Company
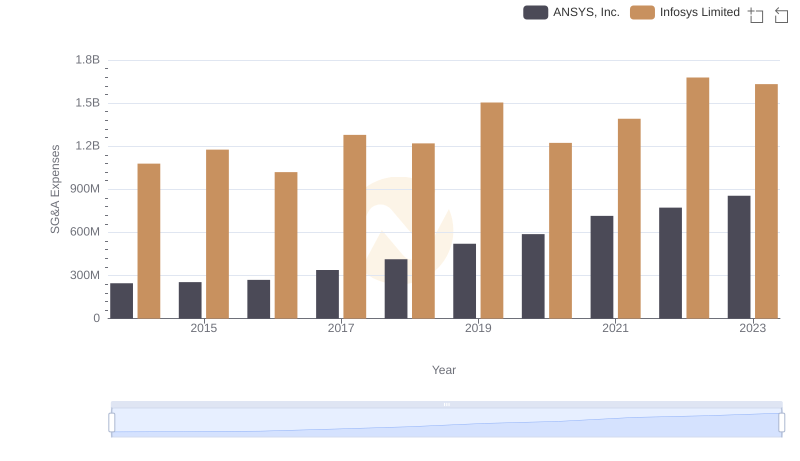
Comparing SG&A Expenses: Infosys Limited vs ANSYS, Inc. Trends and Insights
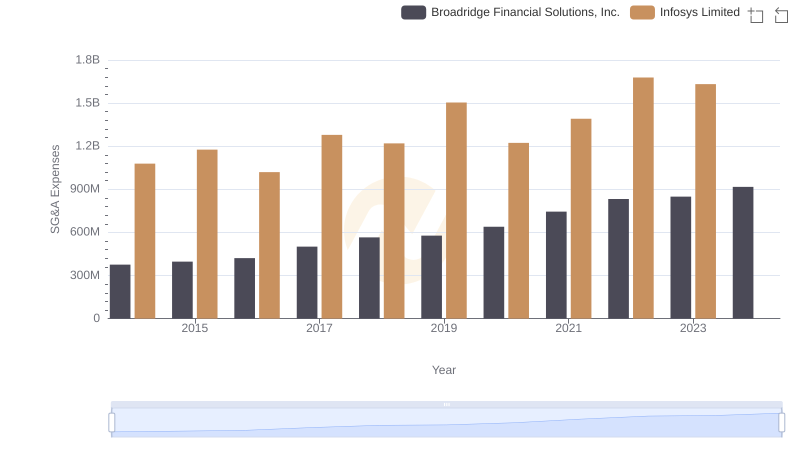
Comparing SG&A Expenses: Infosys Limited vs Broadridge Financial Solutions, Inc. Trends and Insights
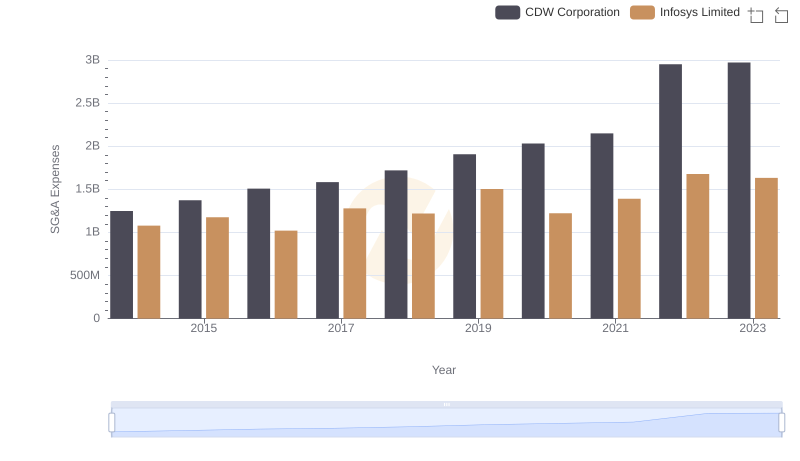
Operational Costs Compared: SG&A Analysis of Infosys Limited and CDW Corporation
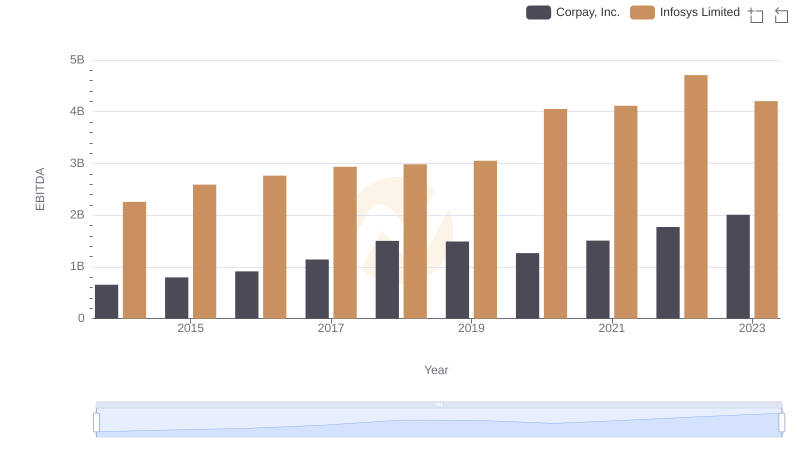
Infosys Limited and Corpay, Inc.: A Detailed Examination of EBITDA Performance