| __timestamp | Broadridge Financial Solutions, Inc. | Infosys Limited |
|---|---|---|
| Wednesday, January 1, 2014 | 515600000 | 2258000000 |
| Thursday, January 1, 2015 | 571200000 | 2590000000 |
| Friday, January 1, 2016 | 608400000 | 2765000000 |
| Sunday, January 1, 2017 | 706000000 | 2936000000 |
| Monday, January 1, 2018 | 815500000 | 2984000000 |
| Tuesday, January 1, 2019 | 912800000 | 3053000000 |
| Wednesday, January 1, 2020 | 924200000 | 4053342784 |
| Friday, January 1, 2021 | 1013300000 | 4116000000 |
| Saturday, January 1, 2022 | 1223900000 | 4707334610 |
| Sunday, January 1, 2023 | 1361400000 | 4206000000 |
| Monday, January 1, 2024 | 1505500000 |
Igniting the spark of knowledge
In the ever-evolving landscape of global finance, understanding the EBITDA performance of industry giants like Infosys Limited and Broadridge Financial Solutions, Inc. offers valuable insights. Over the past decade, Infosys has consistently outperformed Broadridge, with an average EBITDA nearly four times higher. From 2014 to 2023, Infosys saw a remarkable growth of approximately 86%, peaking in 2022. Meanwhile, Broadridge demonstrated steady growth, with a 192% increase over the same period, reaching its highest EBITDA in 2024. This trend underscores Broadridge's robust expansion strategy, despite Infosys's larger scale. Notably, 2024 data for Infosys is missing, leaving room for speculation on its future trajectory. As the financial world continues to shift, these figures highlight the dynamic nature of corporate growth and the strategic maneuvers that drive it.
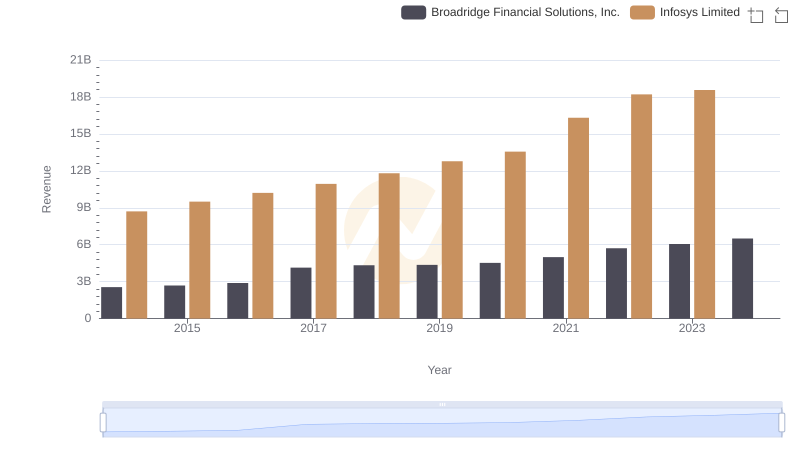
Breaking Down Revenue Trends: Infosys Limited vs Broadridge Financial Solutions, Inc.
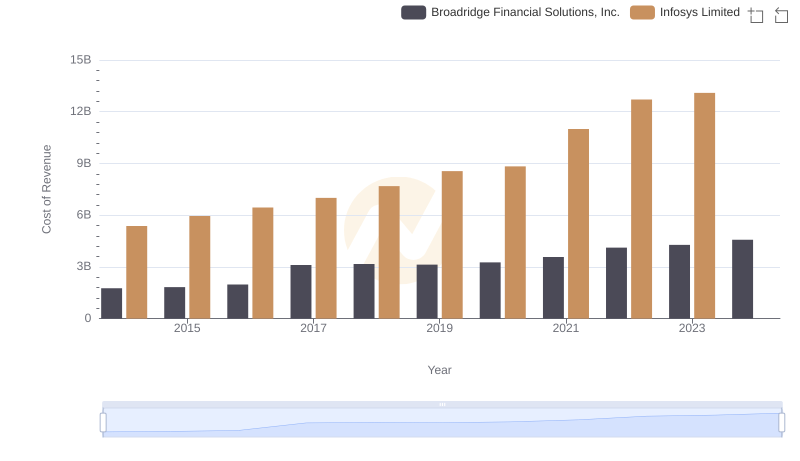
Comparing Cost of Revenue Efficiency: Infosys Limited vs Broadridge Financial Solutions, Inc.
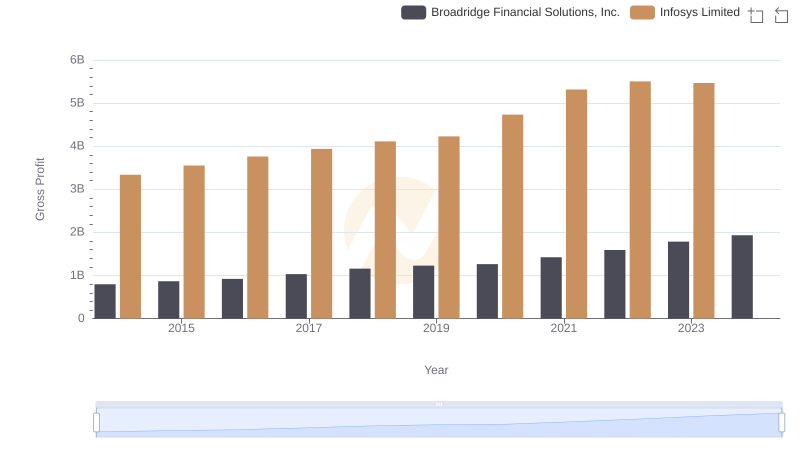
Gross Profit Comparison: Infosys Limited and Broadridge Financial Solutions, Inc. Trends
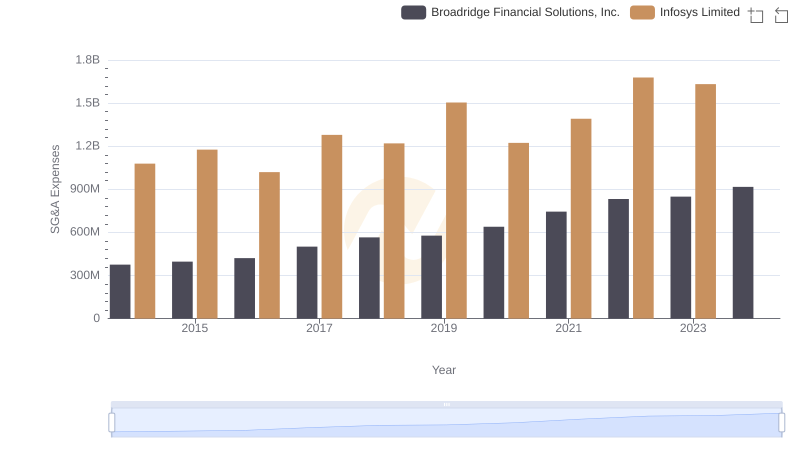
Comparing SG&A Expenses: Infosys Limited vs Broadridge Financial Solutions, Inc. Trends and Insights
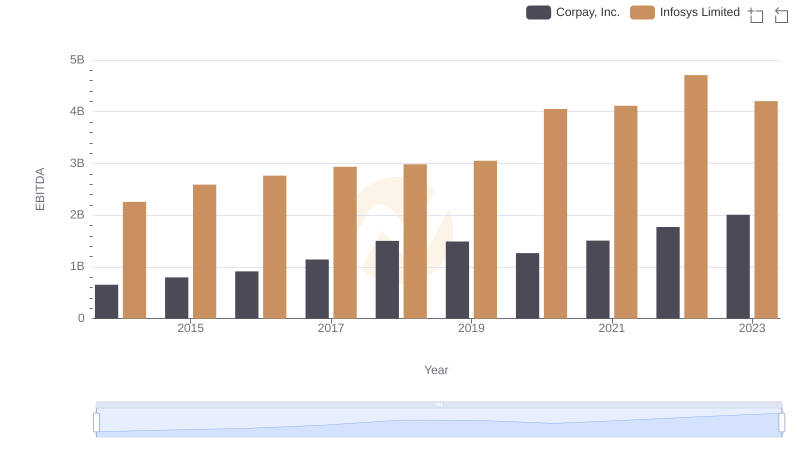
Infosys Limited and Corpay, Inc.: A Detailed Examination of EBITDA Performance
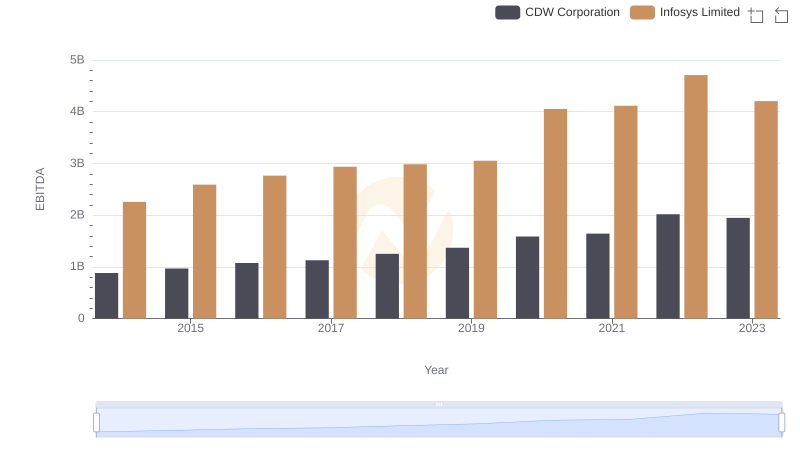
EBITDA Performance Review: Infosys Limited vs CDW Corporation
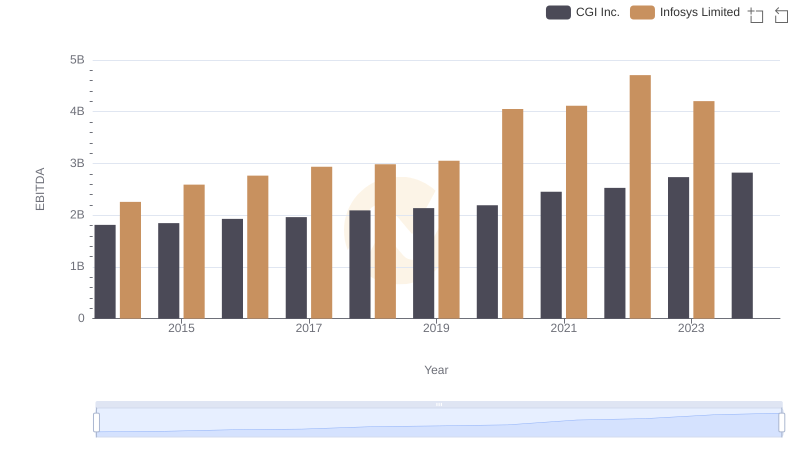
A Professional Review of EBITDA: Infosys Limited Compared to CGI Inc.
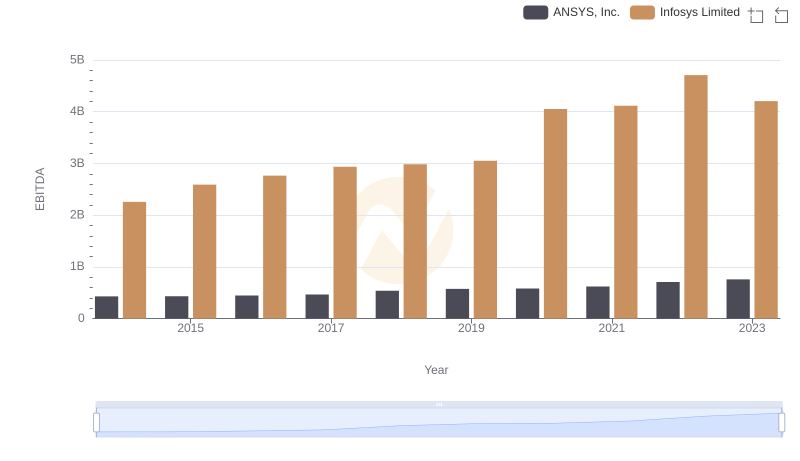
EBITDA Performance Review: Infosys Limited vs ANSYS, Inc.
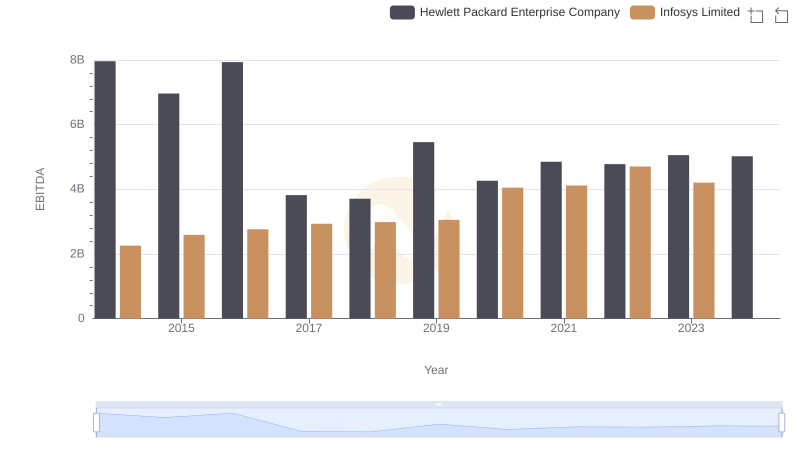
EBITDA Performance Review: Infosys Limited vs Hewlett Packard Enterprise Company
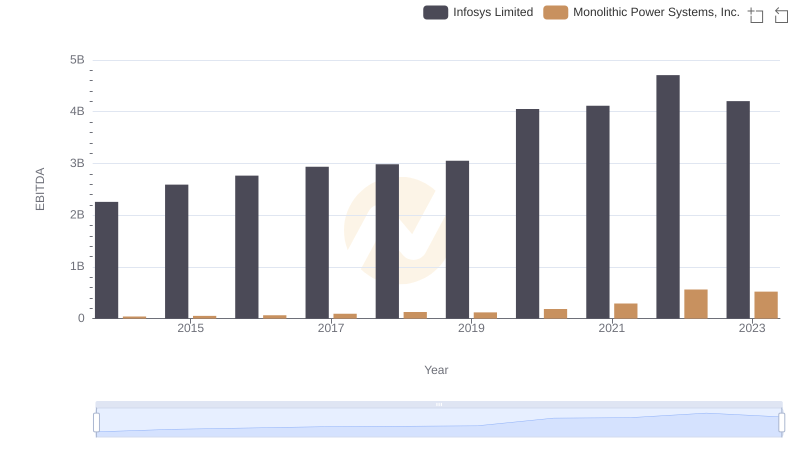
Comparative EBITDA Analysis: Infosys Limited vs Monolithic Power Systems, Inc.
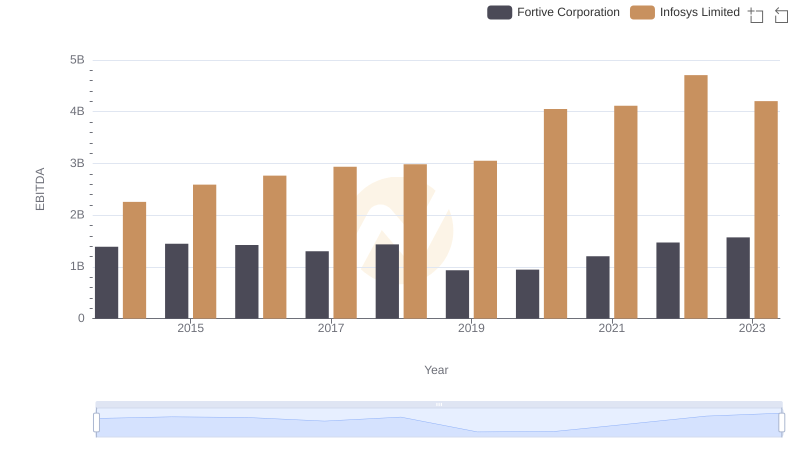
Comprehensive EBITDA Comparison: Infosys Limited vs Fortive Corporation
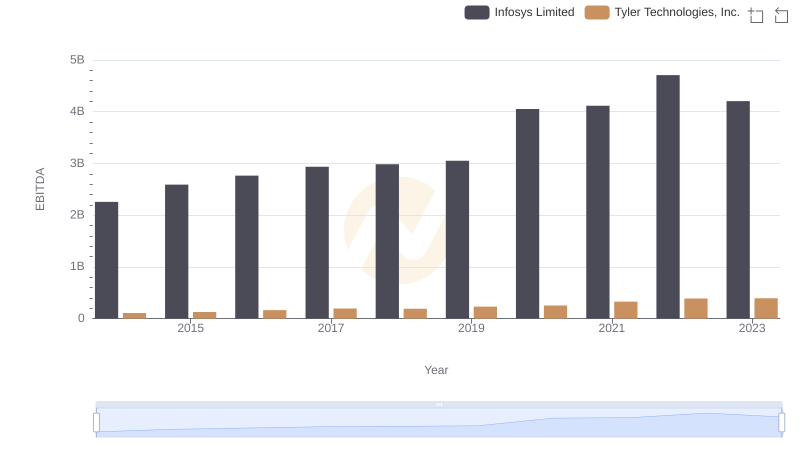
Comprehensive EBITDA Comparison: Infosys Limited vs Tyler Technologies, Inc.