| __timestamp | Broadridge Financial Solutions, Inc. | Infosys Limited |
|---|---|---|
| Wednesday, January 1, 2014 | 2558000000 | 8711000000 |
| Thursday, January 1, 2015 | 2694200000 | 9501000000 |
| Friday, January 1, 2016 | 2897000000 | 10208000000 |
| Sunday, January 1, 2017 | 4142600000 | 10939000000 |
| Monday, January 1, 2018 | 4329900000 | 11799000000 |
| Tuesday, January 1, 2019 | 4362200000 | 12780000000 |
| Wednesday, January 1, 2020 | 4529000000 | 13561000000 |
| Friday, January 1, 2021 | 4993700000 | 16311000000 |
| Saturday, January 1, 2022 | 5709100000 | 18212000000 |
| Sunday, January 1, 2023 | 6060900000 | 18562000000 |
| Monday, January 1, 2024 | 6506800000 |
Unleashing the power of data
In the ever-evolving landscape of global finance and technology, two giants, Infosys Limited and Broadridge Financial Solutions, Inc., have showcased remarkable revenue trajectories over the past decade. From 2014 to 2023, Infosys Limited, a leader in IT services, has seen its revenue grow by approximately 113%, peaking at $18.56 billion in 2023. Meanwhile, Broadridge Financial Solutions, a key player in financial technology, experienced a robust 154% increase, reaching $6.51 billion in 2024.
This comparison highlights the dynamic growth patterns of these industry leaders. While Infosys consistently outpaces Broadridge in absolute revenue, Broadridge's growth rate is noteworthy, reflecting its strategic expansions and innovations. The data for 2024 shows a gap for Infosys, indicating potential future updates. As these companies continue to innovate, their revenue trends offer valuable insights into the broader market dynamics.
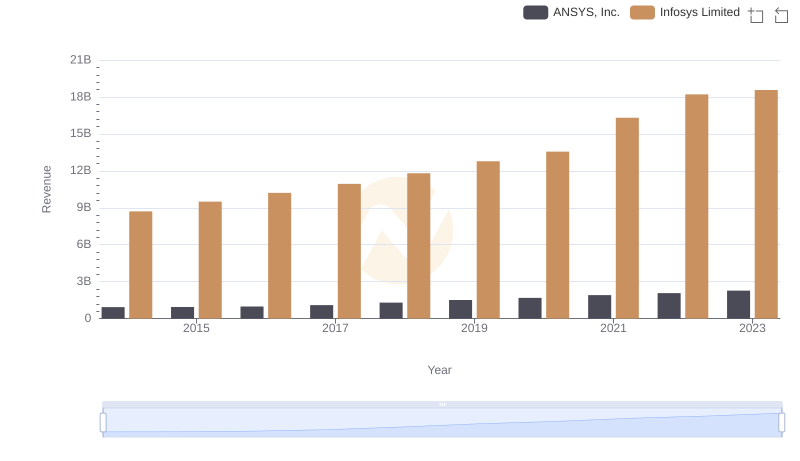
Infosys Limited or ANSYS, Inc.: Who Leads in Yearly Revenue?
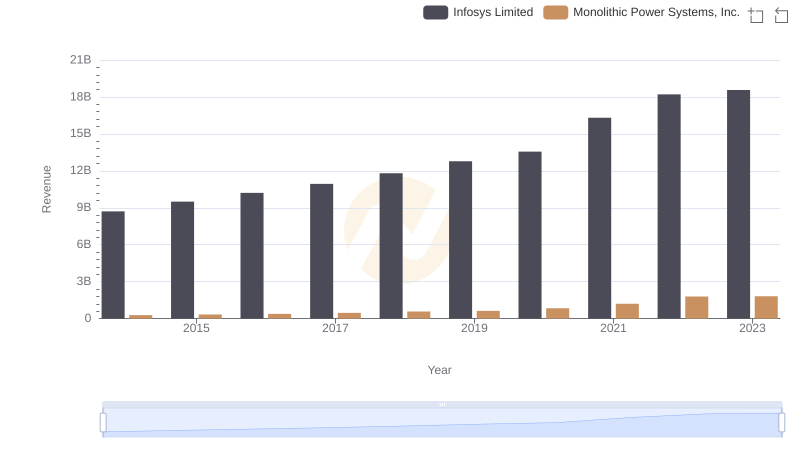
Infosys Limited vs Monolithic Power Systems, Inc.: Annual Revenue Growth Compared
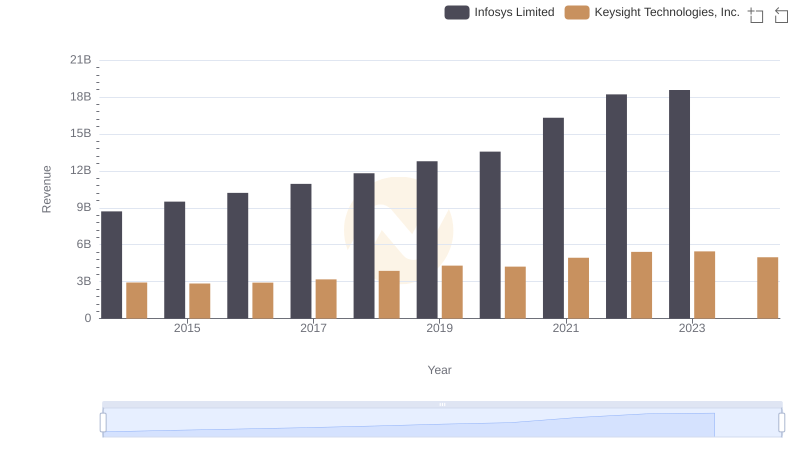
Revenue Showdown: Infosys Limited vs Keysight Technologies, Inc.
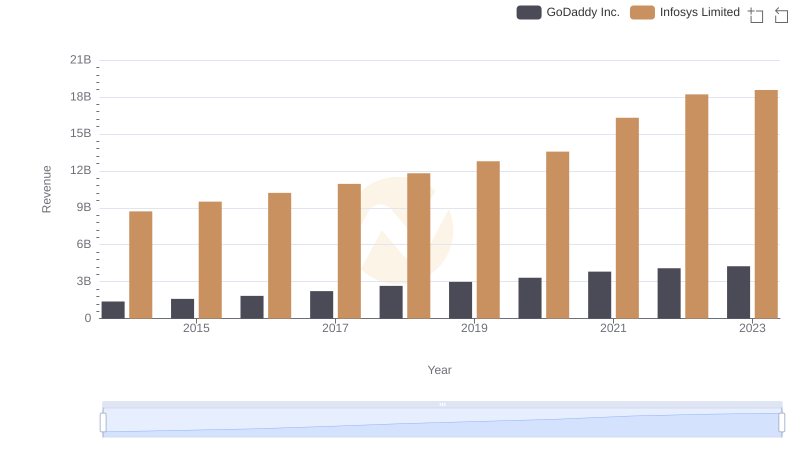
Infosys Limited or GoDaddy Inc.: Who Leads in Yearly Revenue?
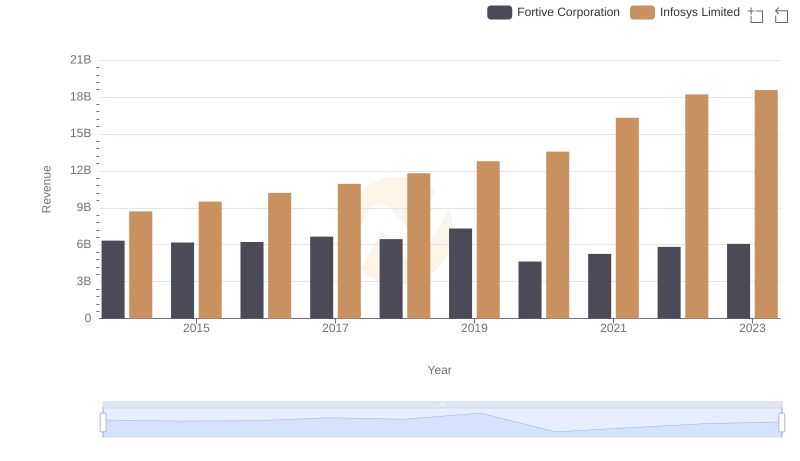
Who Generates More Revenue? Infosys Limited or Fortive Corporation
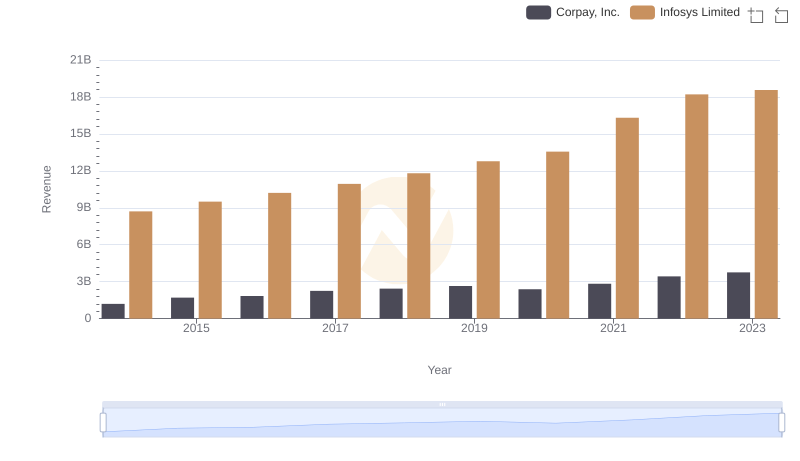
Revenue Showdown: Infosys Limited vs Corpay, Inc.
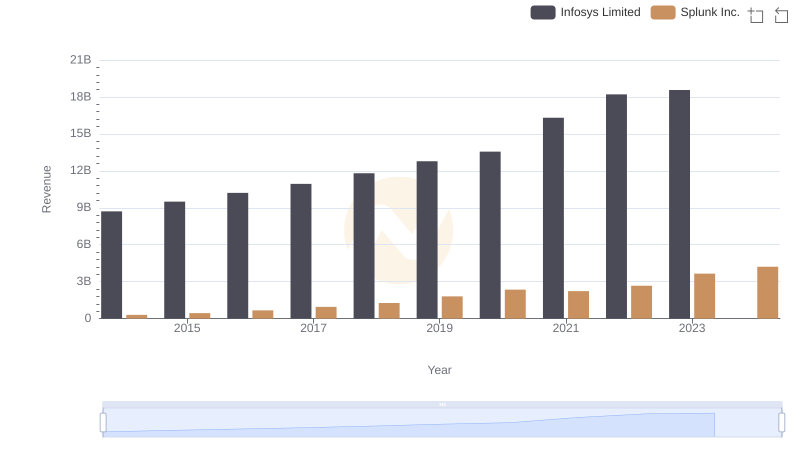
Breaking Down Revenue Trends: Infosys Limited vs Splunk Inc.
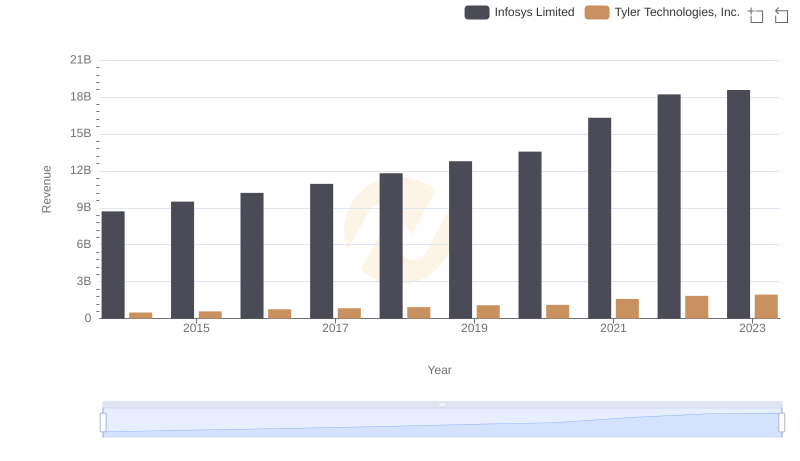
Annual Revenue Comparison: Infosys Limited vs Tyler Technologies, Inc.
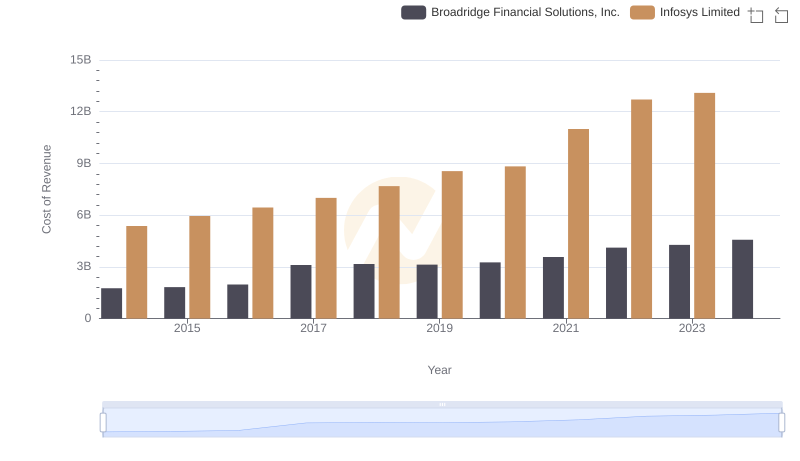
Comparing Cost of Revenue Efficiency: Infosys Limited vs Broadridge Financial Solutions, Inc.
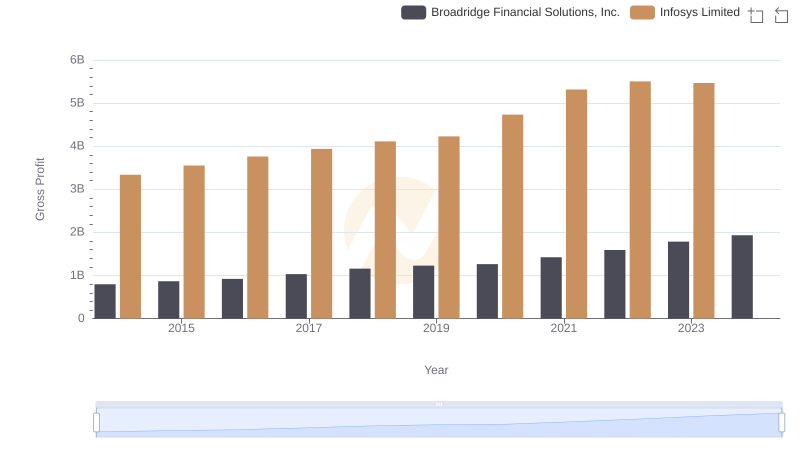
Gross Profit Comparison: Infosys Limited and Broadridge Financial Solutions, Inc. Trends
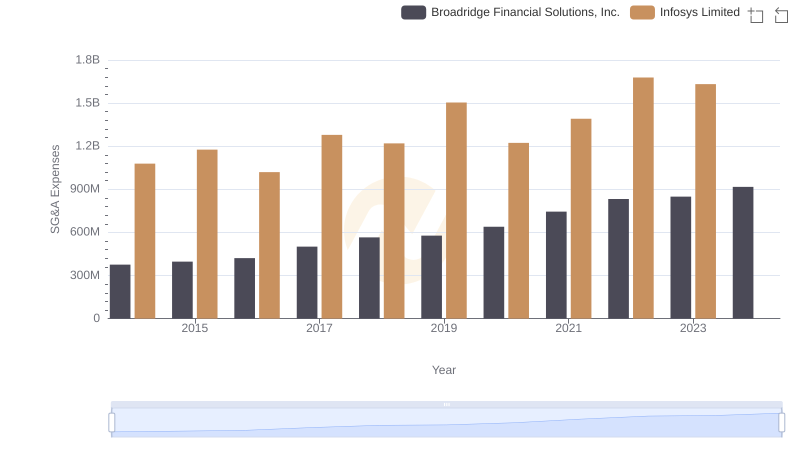
Comparing SG&A Expenses: Infosys Limited vs Broadridge Financial Solutions, Inc. Trends and Insights
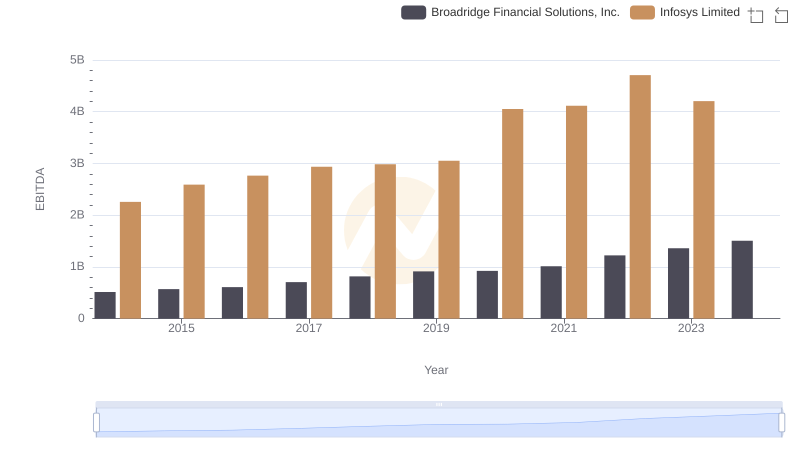
Infosys Limited and Broadridge Financial Solutions, Inc.: A Detailed Examination of EBITDA Performance