| __timestamp | Broadridge Financial Solutions, Inc. | Infosys Limited |
|---|---|---|
| Wednesday, January 1, 2014 | 796600000 | 3337000000 |
| Thursday, January 1, 2015 | 866000000 | 3551000000 |
| Friday, January 1, 2016 | 921100000 | 3762000000 |
| Sunday, January 1, 2017 | 1033000000 | 3938000000 |
| Monday, January 1, 2018 | 1160300000 | 4112000000 |
| Tuesday, January 1, 2019 | 1230300000 | 4228000000 |
| Wednesday, January 1, 2020 | 1263900000 | 4733000000 |
| Friday, January 1, 2021 | 1422900000 | 5315000000 |
| Saturday, January 1, 2022 | 1592200000 | 5503000000 |
| Sunday, January 1, 2023 | 1785400000 | 5466000000 |
| Monday, January 1, 2024 | 1933900000 |
Unlocking the unknown
In the ever-evolving landscape of global finance and technology, two companies stand out for their impressive growth trajectories: Infosys Limited and Broadridge Financial Solutions, Inc. Over the past decade, these industry leaders have demonstrated remarkable resilience and adaptability. From 2014 to 2023, Infosys has consistently outperformed Broadridge in terms of gross profit, with an average of 4.4 billion compared to Broadridge's 1.3 billion. Notably, Infosys saw a 65% increase in gross profit from 2014 to 2023, peaking at 5.5 billion in 2022. Meanwhile, Broadridge's gross profit grew by 142% during the same period, reaching 1.9 billion in 2024. This data highlights the dynamic nature of the tech and financial sectors, where strategic innovation and market adaptation are key to sustained success. As we look to the future, the missing data for Infosys in 2024 leaves room for speculation and anticipation.
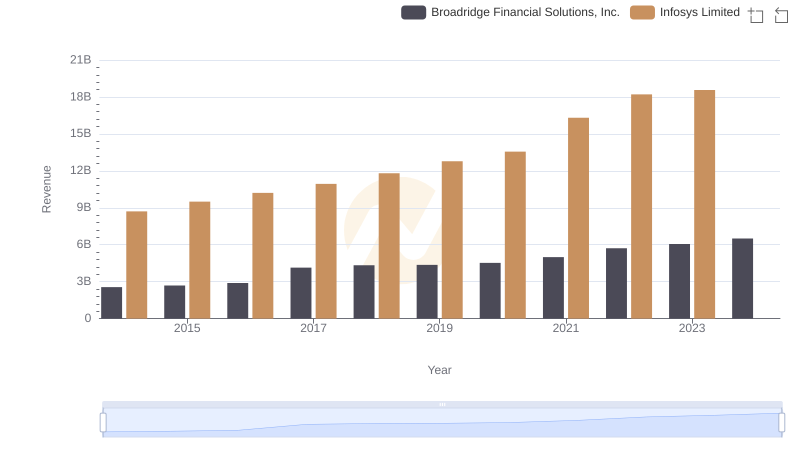
Breaking Down Revenue Trends: Infosys Limited vs Broadridge Financial Solutions, Inc.
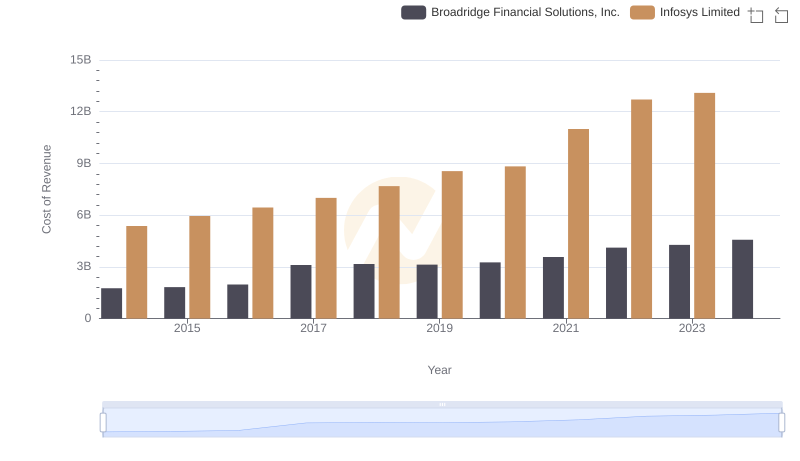
Comparing Cost of Revenue Efficiency: Infosys Limited vs Broadridge Financial Solutions, Inc.
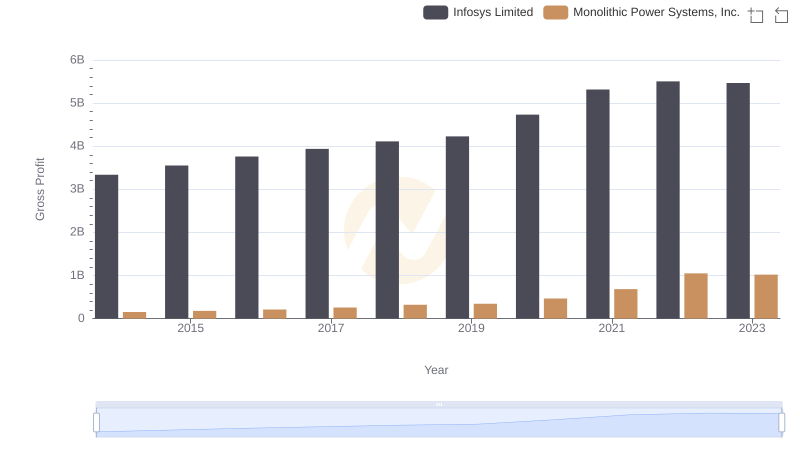
Infosys Limited and Monolithic Power Systems, Inc.: A Detailed Gross Profit Analysis
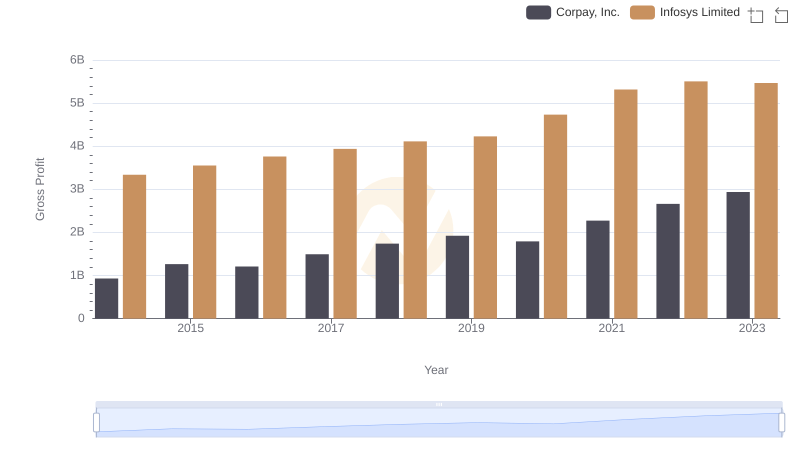
Gross Profit Analysis: Comparing Infosys Limited and Corpay, Inc.
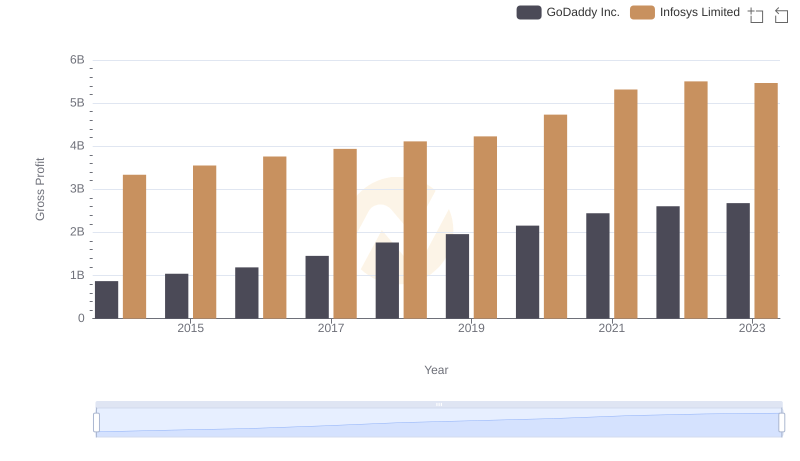
Gross Profit Trends Compared: Infosys Limited vs GoDaddy Inc.
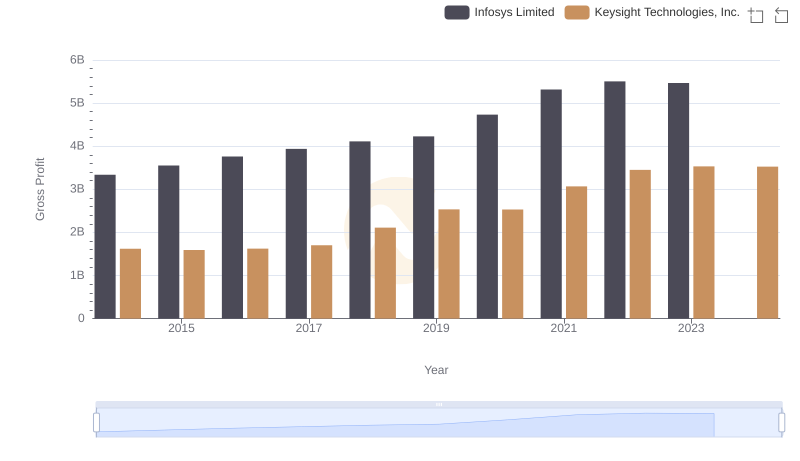
Gross Profit Comparison: Infosys Limited and Keysight Technologies, Inc. Trends
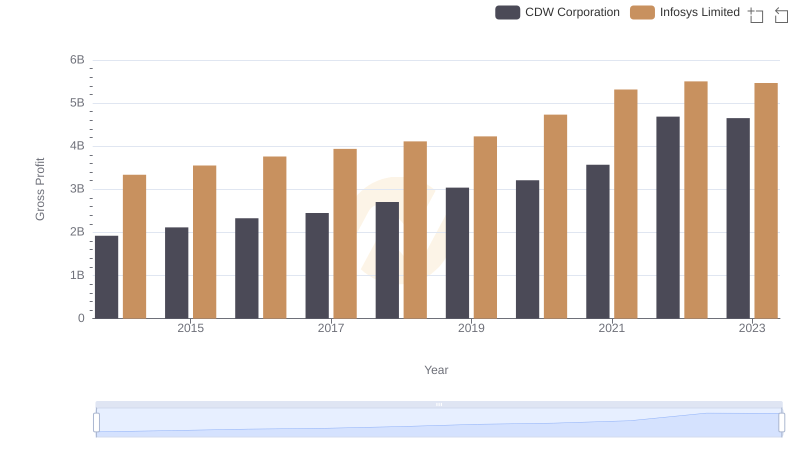
Who Generates Higher Gross Profit? Infosys Limited or CDW Corporation
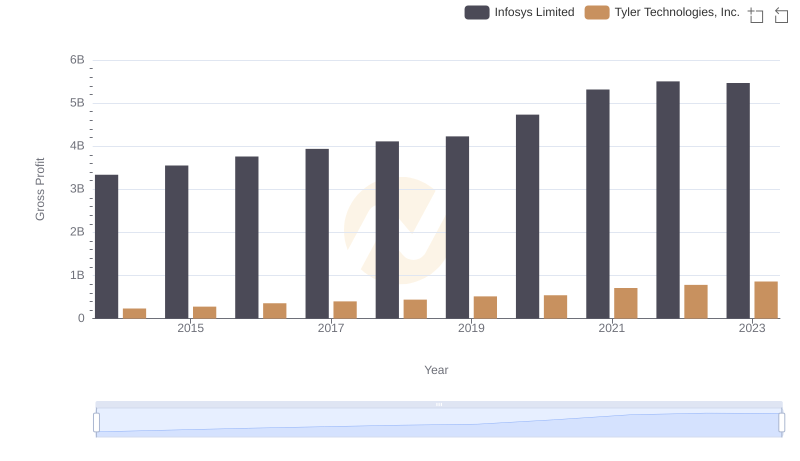
Gross Profit Trends Compared: Infosys Limited vs Tyler Technologies, Inc.
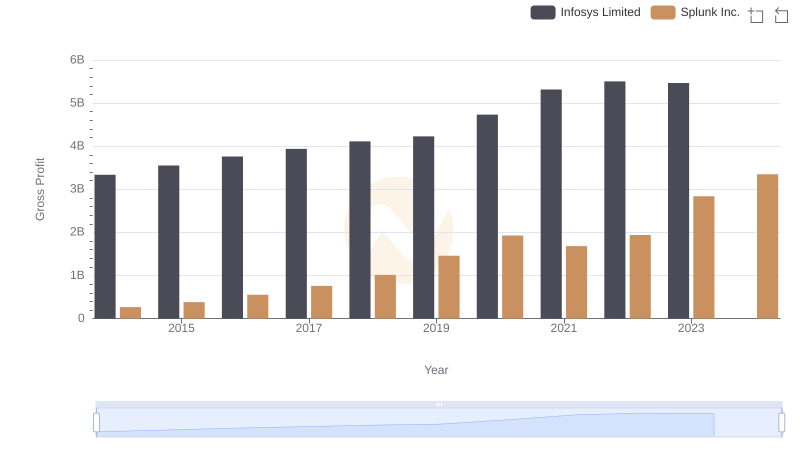
Infosys Limited and Splunk Inc.: A Detailed Gross Profit Analysis
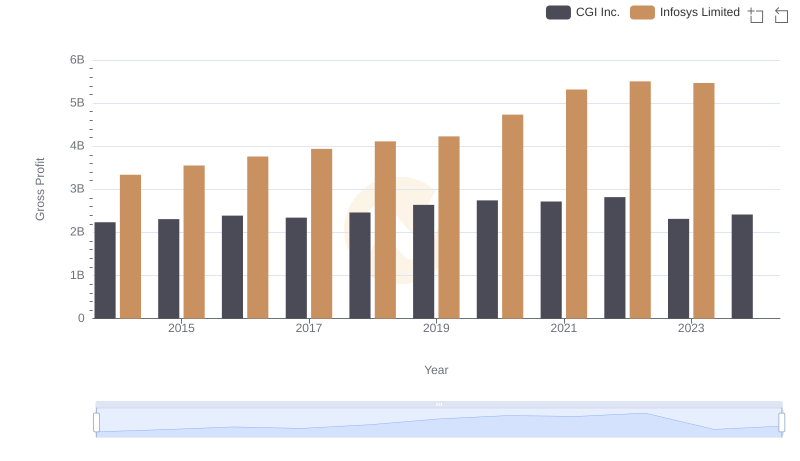
Gross Profit Comparison: Infosys Limited and CGI Inc. Trends
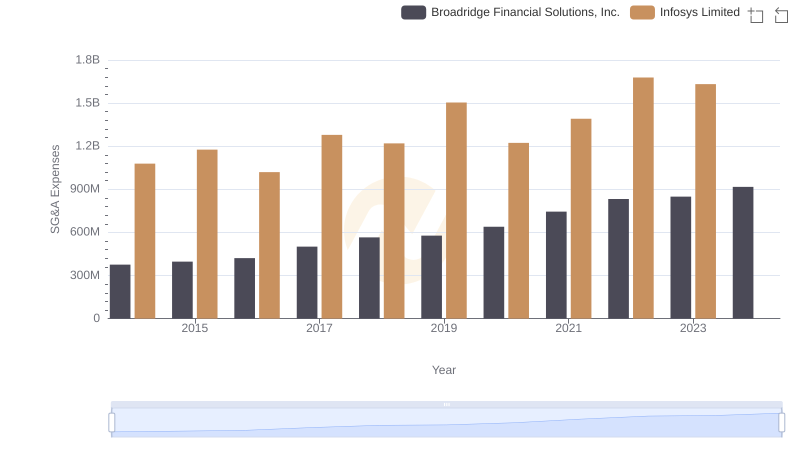
Comparing SG&A Expenses: Infosys Limited vs Broadridge Financial Solutions, Inc. Trends and Insights
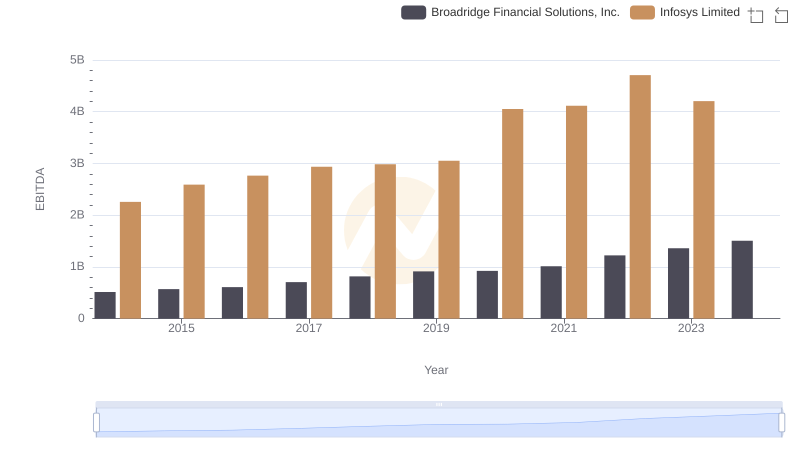
Infosys Limited and Broadridge Financial Solutions, Inc.: A Detailed Examination of EBITDA Performance