| __timestamp | Axon Enterprise, Inc. | IDEX Corporation |
|---|---|---|
| Wednesday, January 1, 2014 | 54158000 | 504419000 |
| Thursday, January 1, 2015 | 69698000 | 479408000 |
| Friday, January 1, 2016 | 108076000 | 498994000 |
| Sunday, January 1, 2017 | 138692000 | 524940000 |
| Monday, January 1, 2018 | 156886000 | 536724000 |
| Tuesday, January 1, 2019 | 212959000 | 524987000 |
| Wednesday, January 1, 2020 | 307286000 | 494935000 |
| Friday, January 1, 2021 | 515007000 | 578200000 |
| Saturday, January 1, 2022 | 401575000 | 652700000 |
| Sunday, January 1, 2023 | 496874000 | 703500000 |
| Monday, January 1, 2024 | 758700000 |
Infusing magic into the data realm
In the competitive landscape of corporate America, understanding the financial strategies of leading companies is crucial. This analysis delves into the Selling, General, and Administrative (SG&A) expenses of Axon Enterprise, Inc. and IDEX Corporation from 2014 to 2023.
Axon Enterprise, Inc. has shown a remarkable increase in SG&A expenses, growing by over 800% from 2014 to 2023. This surge reflects Axon's aggressive expansion and investment in administrative capabilities. Notably, the expenses peaked in 2021, indicating a strategic pivot or investment during that period.
Conversely, IDEX Corporation's SG&A expenses have remained relatively stable, with a modest increase of about 40% over the same period. This stability suggests a consistent operational strategy, focusing on efficiency and steady growth.
The contrasting trends between these two companies highlight different strategic approaches: Axon's rapid growth versus IDEX's steady efficiency. Understanding these trends provides valuable insights into their market positioning and future trajectories.

Axon Enterprise, Inc. vs IDEX Corporation: Examining Key Revenue Metrics
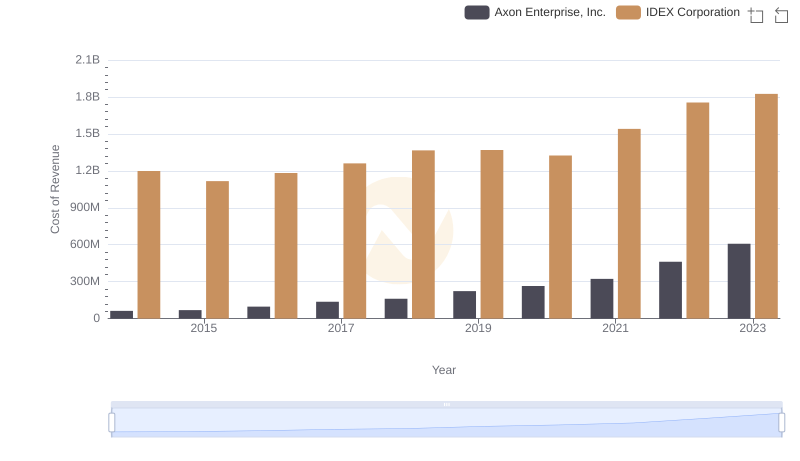
Comparing Cost of Revenue Efficiency: Axon Enterprise, Inc. vs IDEX Corporation
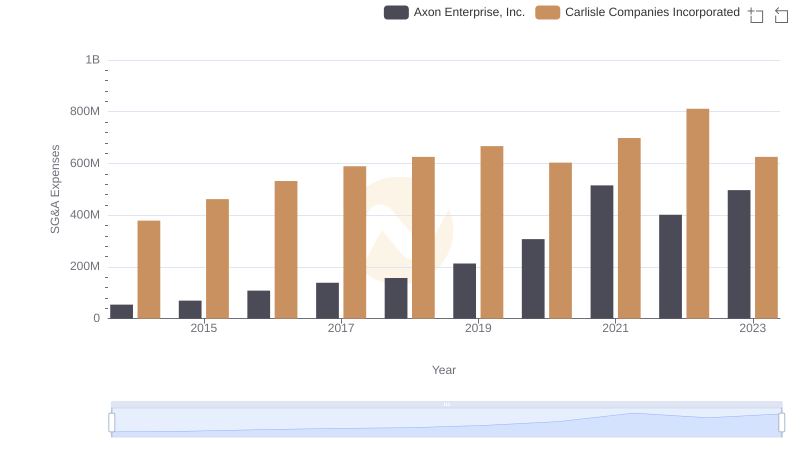
Breaking Down SG&A Expenses: Axon Enterprise, Inc. vs Carlisle Companies Incorporated
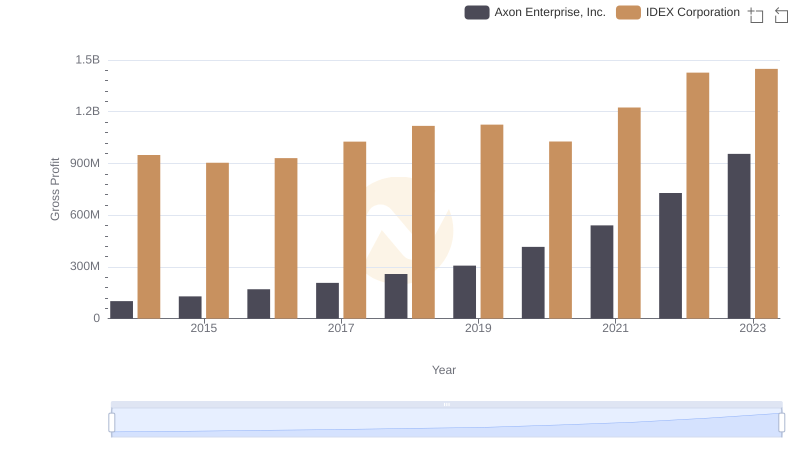
Key Insights on Gross Profit: Axon Enterprise, Inc. vs IDEX Corporation

Breaking Down SG&A Expenses: Axon Enterprise, Inc. vs China Eastern Airlines Corporation Limited

Who Optimizes SG&A Costs Better? Axon Enterprise, Inc. or Pentair plc
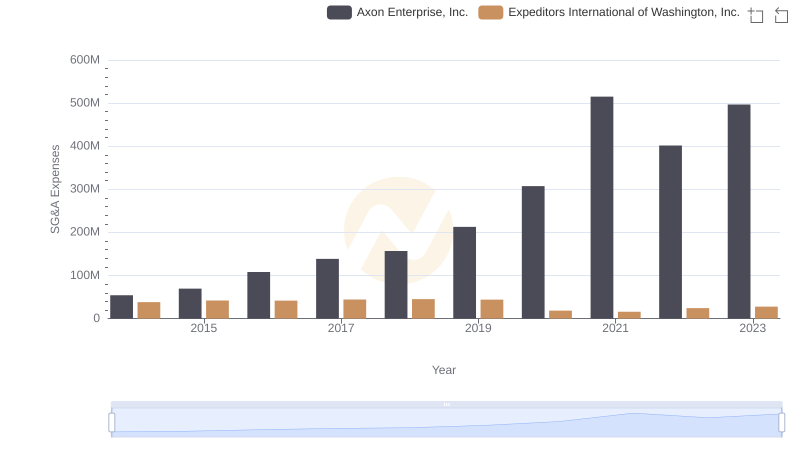
Operational Costs Compared: SG&A Analysis of Axon Enterprise, Inc. and Expeditors International of Washington, Inc.
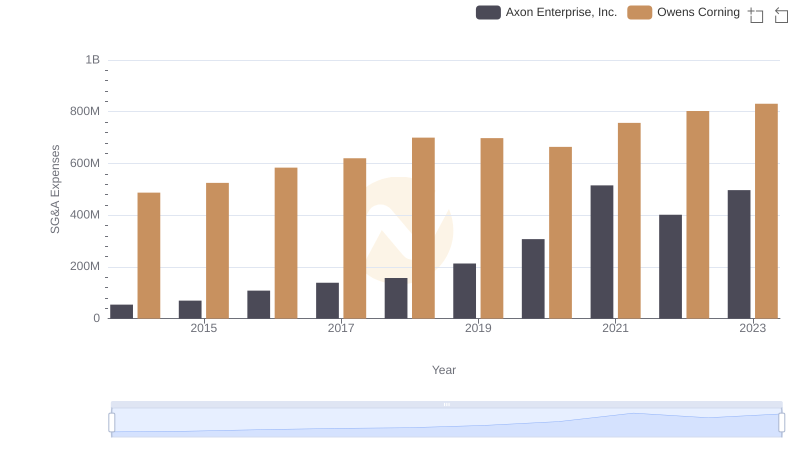
Comparing SG&A Expenses: Axon Enterprise, Inc. vs Owens Corning Trends and Insights
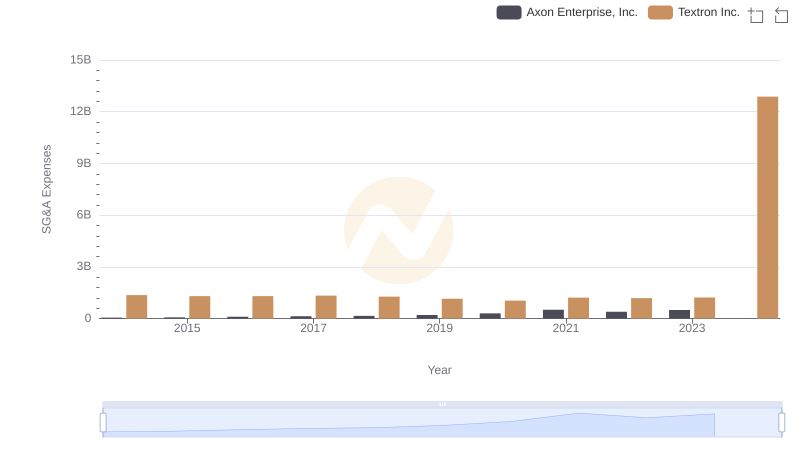
Axon Enterprise, Inc. or Textron Inc.: Who Manages SG&A Costs Better?
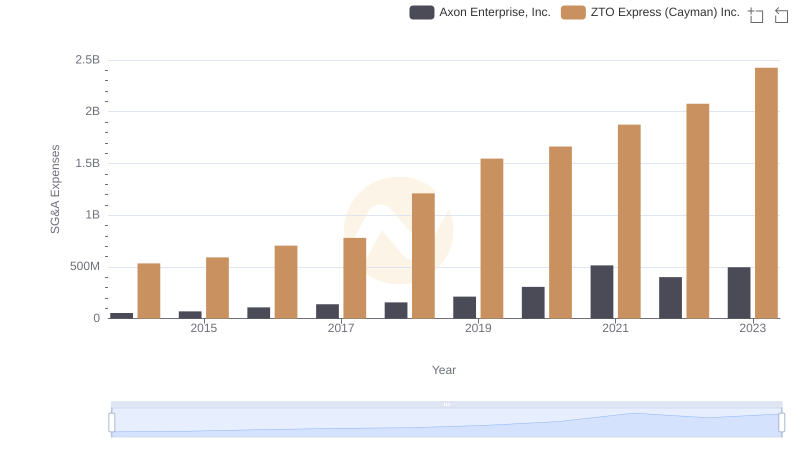
Axon Enterprise, Inc. or ZTO Express (Cayman) Inc.: Who Manages SG&A Costs Better?
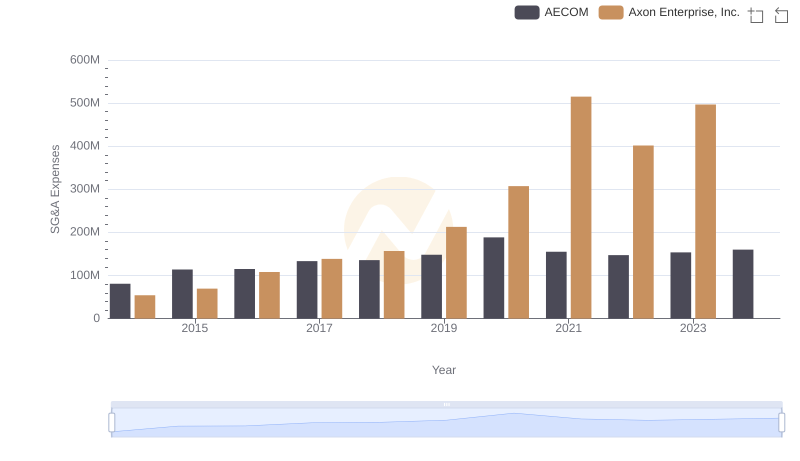
Who Optimizes SG&A Costs Better? Axon Enterprise, Inc. or AECOM