| __timestamp | Axon Enterprise, Inc. | IDEX Corporation |
|---|---|---|
| Wednesday, January 1, 2014 | 101548000 | 949315000 |
| Thursday, January 1, 2015 | 128647000 | 904315000 |
| Friday, January 1, 2016 | 170536000 | 930767000 |
| Sunday, January 1, 2017 | 207088000 | 1026678000 |
| Monday, January 1, 2018 | 258583000 | 1117895000 |
| Tuesday, January 1, 2019 | 307286000 | 1125034000 |
| Wednesday, January 1, 2020 | 416331000 | 1027424000 |
| Friday, January 1, 2021 | 540910000 | 1224500000 |
| Saturday, January 1, 2022 | 728638000 | 1426900000 |
| Sunday, January 1, 2023 | 955382000 | 1448500000 |
| Monday, January 1, 2024 | 1454800000 |
Unveiling the hidden dimensions of data
In the ever-evolving landscape of the American stock market, the journey of Axon Enterprise, Inc. and IDEX Corporation over the past decade offers a compelling narrative of growth and resilience. From 2014 to 2023, Axon Enterprise, Inc. has seen its gross profit skyrocket by over 840%, starting from a modest $101 million to an impressive $955 million. This remarkable growth underscores Axon's strategic innovations and market adaptability.
Meanwhile, IDEX Corporation, a stalwart in its industry, has consistently maintained a robust gross profit, growing by approximately 53% over the same period. By 2023, IDEX's gross profit reached $1.45 billion, reflecting its steady market presence and operational efficiency.
This comparative analysis not only highlights the dynamic growth trajectories of these two companies but also provides valuable insights into their strategic positioning in the competitive U.S. market.
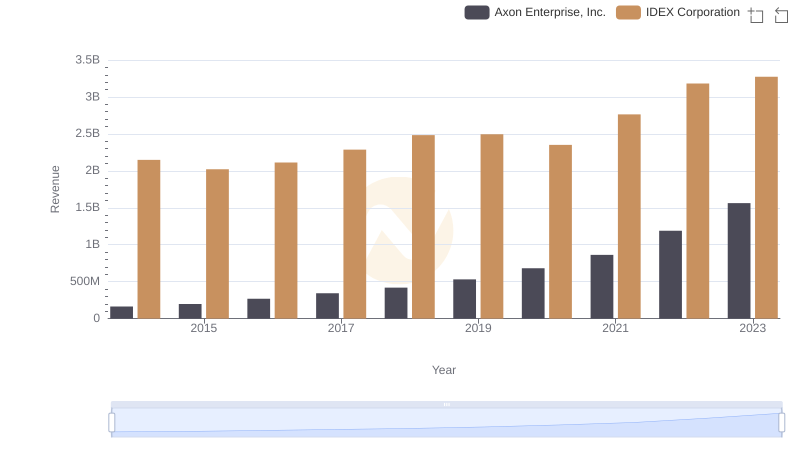
Axon Enterprise, Inc. vs IDEX Corporation: Examining Key Revenue Metrics
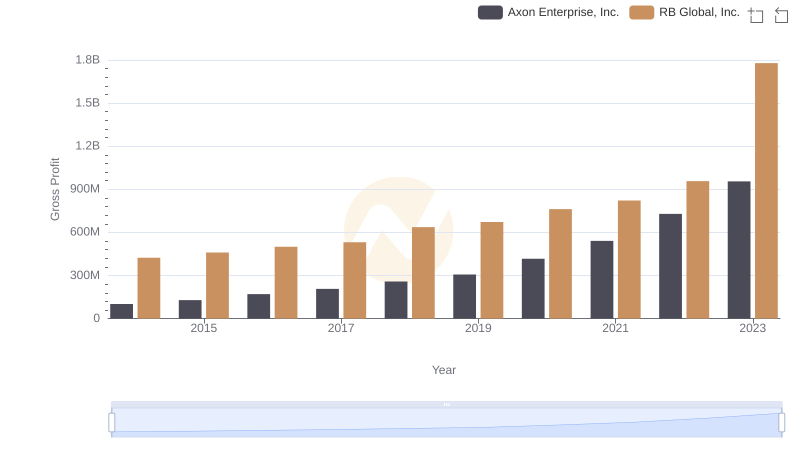
Gross Profit Trends Compared: Axon Enterprise, Inc. vs RB Global, Inc.
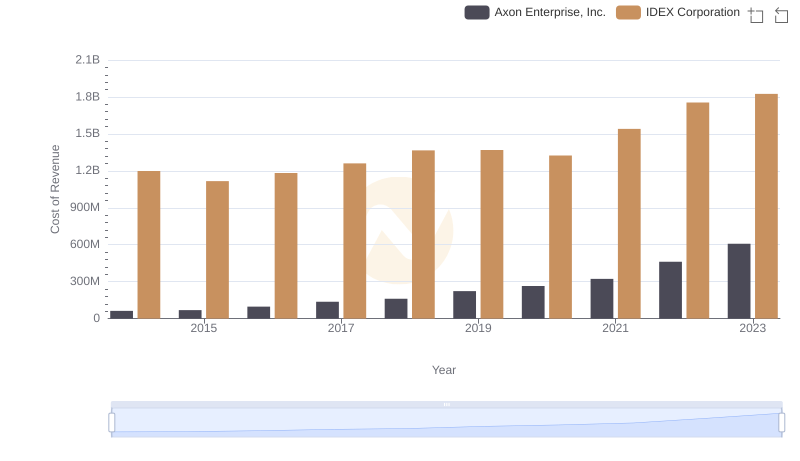
Comparing Cost of Revenue Efficiency: Axon Enterprise, Inc. vs IDEX Corporation
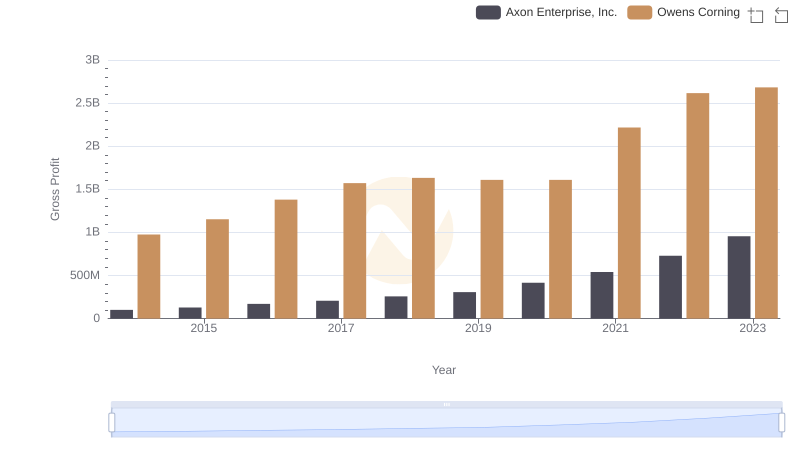
Gross Profit Analysis: Comparing Axon Enterprise, Inc. and Owens Corning
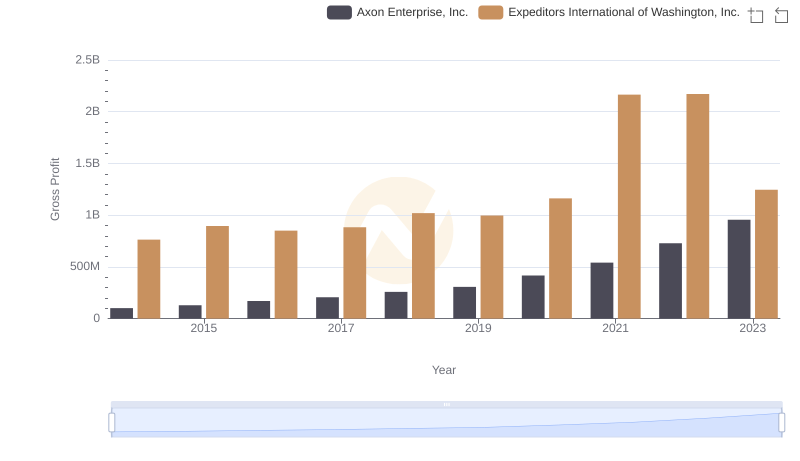
Who Generates Higher Gross Profit? Axon Enterprise, Inc. or Expeditors International of Washington, Inc.
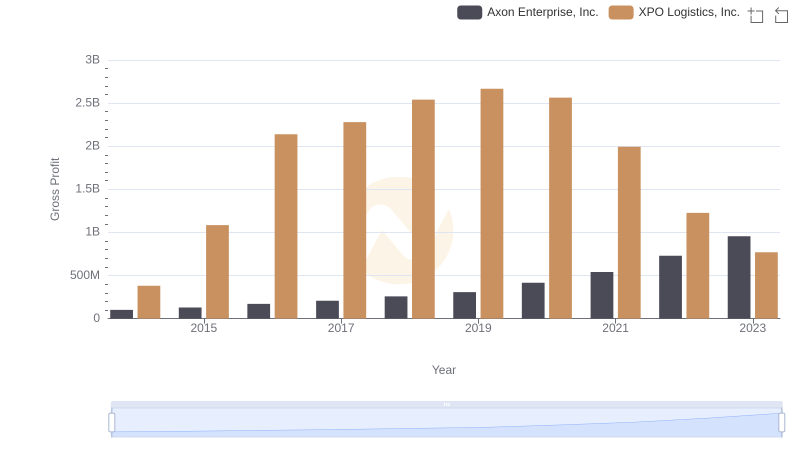
Axon Enterprise, Inc. vs XPO Logistics, Inc.: A Gross Profit Performance Breakdown
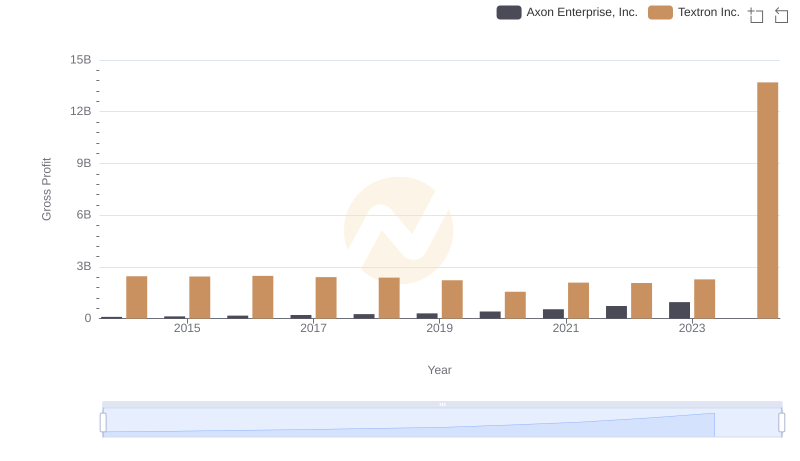
Who Generates Higher Gross Profit? Axon Enterprise, Inc. or Textron Inc.
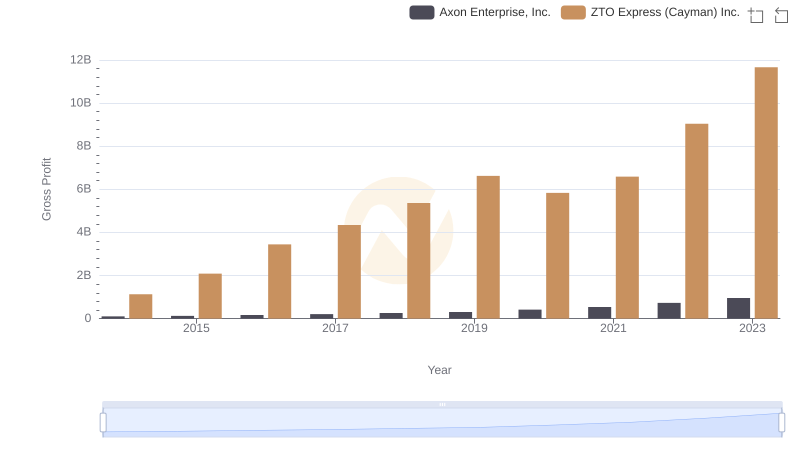
Axon Enterprise, Inc. and ZTO Express (Cayman) Inc.: A Detailed Gross Profit Analysis
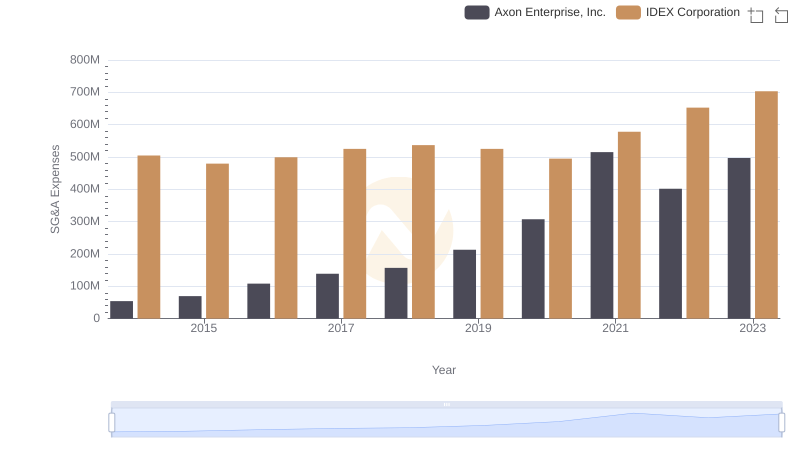
Comparing SG&A Expenses: Axon Enterprise, Inc. vs IDEX Corporation Trends and Insights
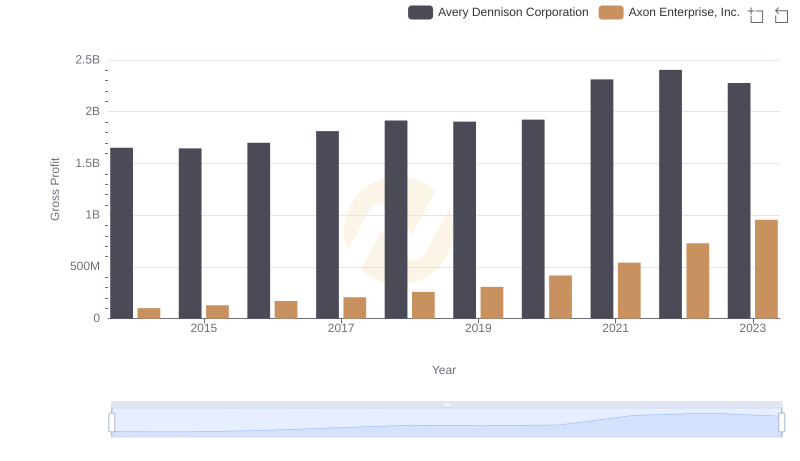
Who Generates Higher Gross Profit? Axon Enterprise, Inc. or Avery Dennison Corporation
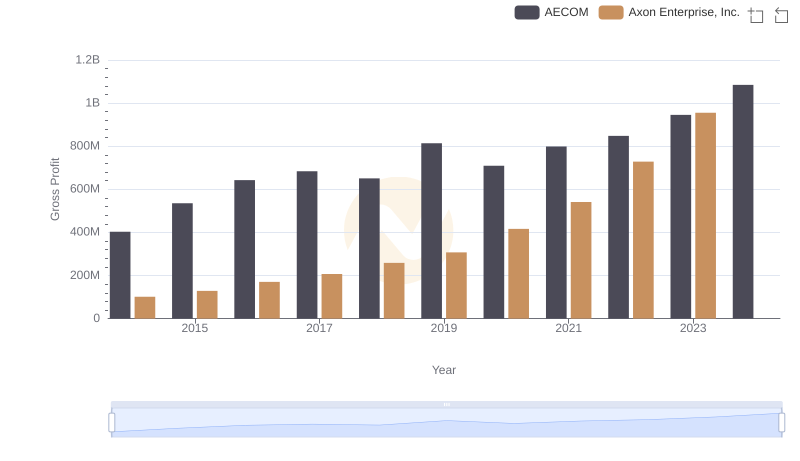
Gross Profit Comparison: Axon Enterprise, Inc. and AECOM Trends