| __timestamp | Axon Enterprise, Inc. | Owens Corning |
|---|---|---|
| Wednesday, January 1, 2014 | 54158000 | 487000000 |
| Thursday, January 1, 2015 | 69698000 | 525000000 |
| Friday, January 1, 2016 | 108076000 | 584000000 |
| Sunday, January 1, 2017 | 138692000 | 620000000 |
| Monday, January 1, 2018 | 156886000 | 700000000 |
| Tuesday, January 1, 2019 | 212959000 | 698000000 |
| Wednesday, January 1, 2020 | 307286000 | 664000000 |
| Friday, January 1, 2021 | 515007000 | 757000000 |
| Saturday, January 1, 2022 | 401575000 | 803000000 |
| Sunday, January 1, 2023 | 496874000 | 831000000 |
Cracking the code
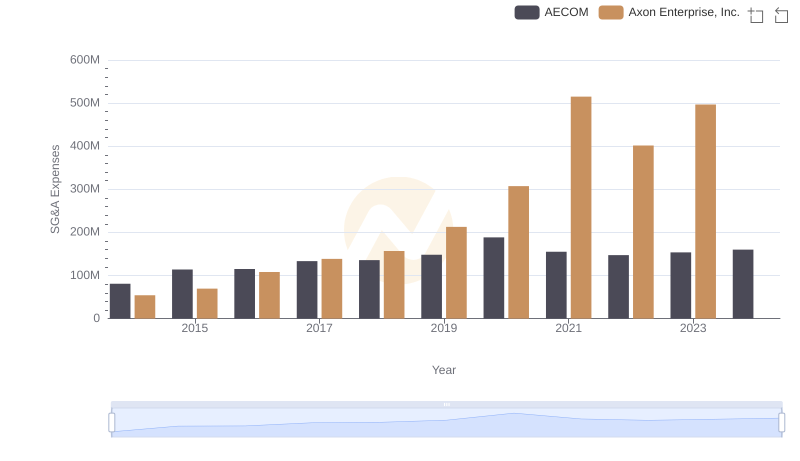
In the ever-evolving landscape of corporate finance, understanding the trends in Selling, General, and Administrative (SG&A) expenses is crucial. This analysis compares the SG&A expenses of Axon Enterprise, Inc. and Owens Corning from 2014 to 2023.
Axon Enterprise, Inc. has shown a remarkable increase in SG&A expenses, growing by over 800% from 2014 to 2023. This surge reflects the company's aggressive expansion and investment in administrative capabilities. Notably, the expenses peaked in 2021, indicating a strategic shift or a response to market dynamics.
Owens Corning, a leader in building materials, has maintained a steady increase in SG&A expenses, with a 70% rise over the same period. This consistent growth aligns with the company's stable market presence and operational efficiency.
While both companies have increased their SG&A expenses, Axon's rapid growth suggests a more dynamic approach, whereas Owens Corning's steady rise indicates a focus on sustainability and efficiency.
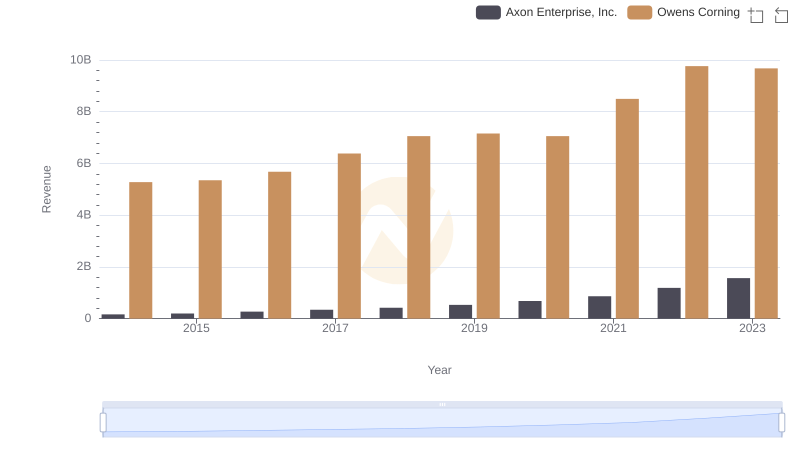
Who Generates More Revenue? Axon Enterprise, Inc. or Owens Corning
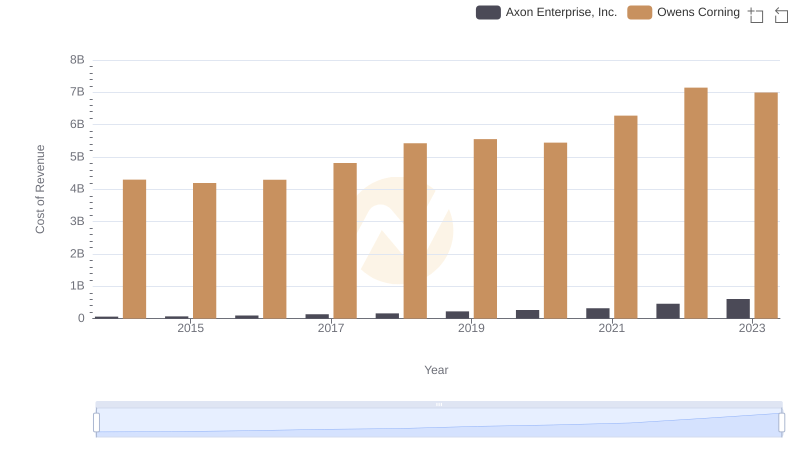
Cost of Revenue: Key Insights for Axon Enterprise, Inc. and Owens Corning
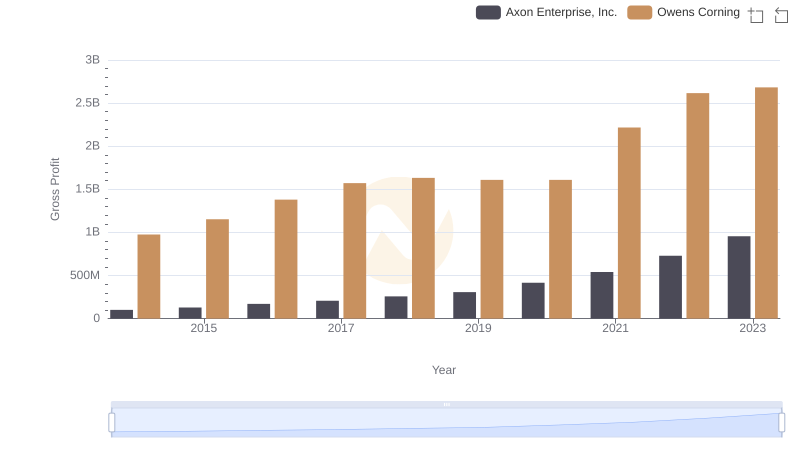
Gross Profit Analysis: Comparing Axon Enterprise, Inc. and Owens Corning

Breaking Down SG&A Expenses: Axon Enterprise, Inc. vs China Eastern Airlines Corporation Limited

Who Optimizes SG&A Costs Better? Axon Enterprise, Inc. or Pentair plc
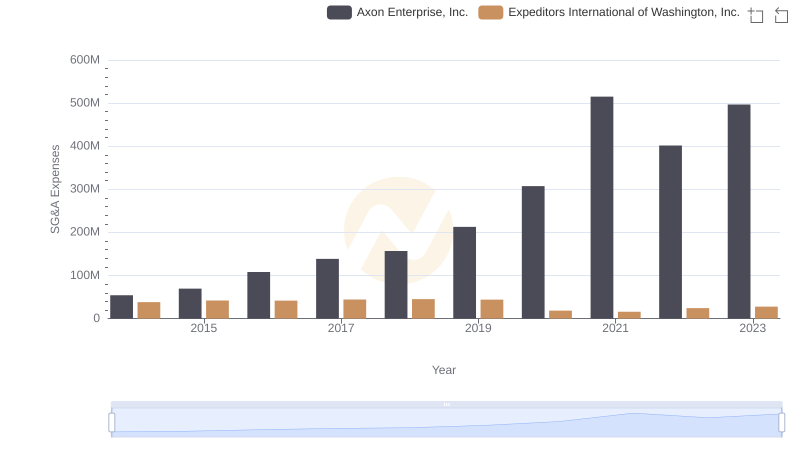
Operational Costs Compared: SG&A Analysis of Axon Enterprise, Inc. and Expeditors International of Washington, Inc.
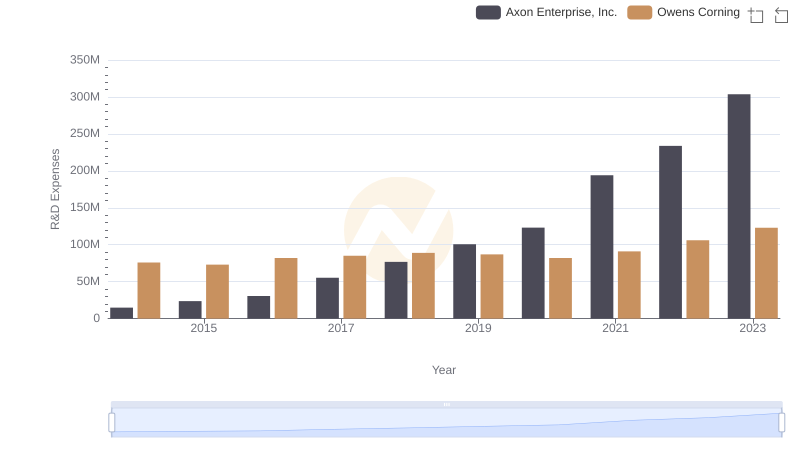
Research and Development Investment: Axon Enterprise, Inc. vs Owens Corning
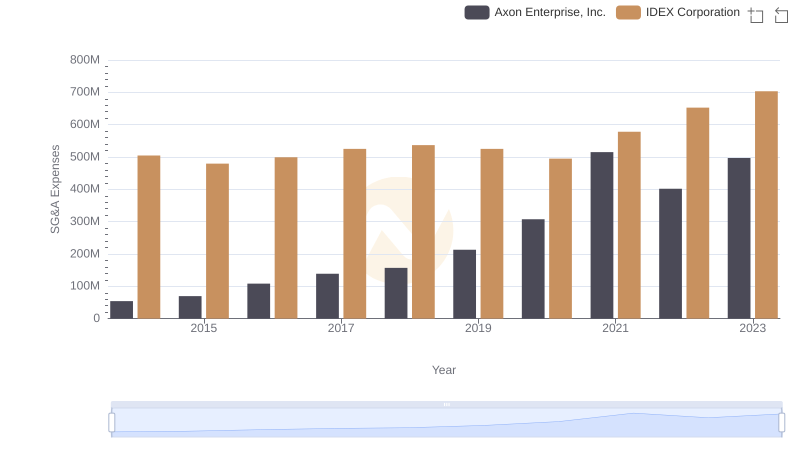
Comparing SG&A Expenses: Axon Enterprise, Inc. vs IDEX Corporation Trends and Insights
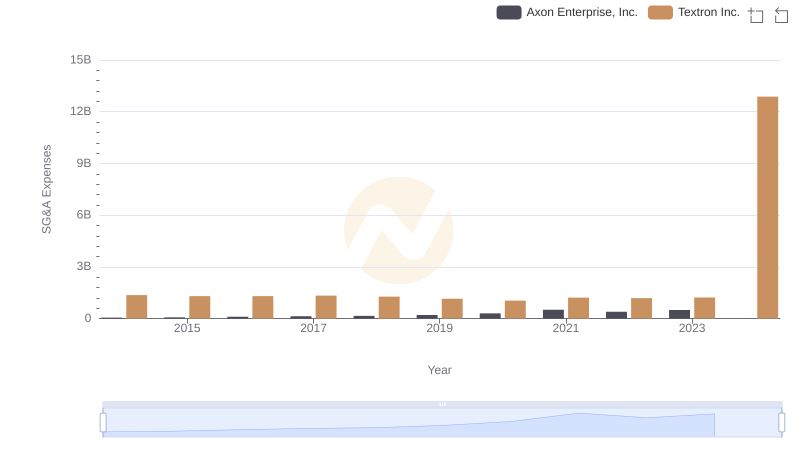
Axon Enterprise, Inc. or Textron Inc.: Who Manages SG&A Costs Better?
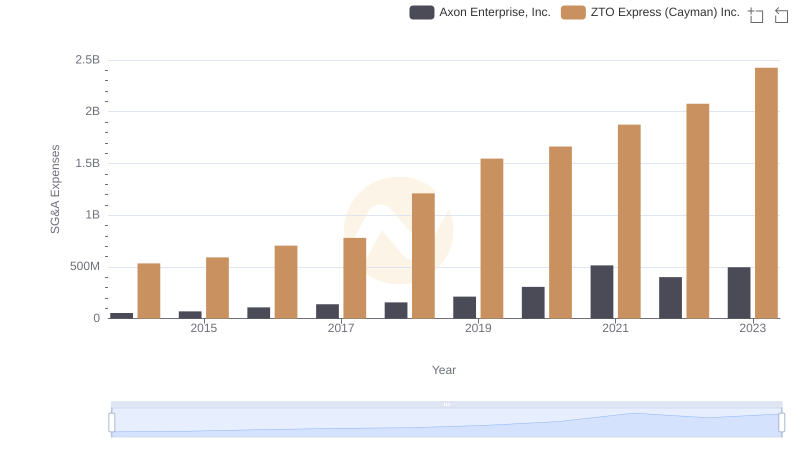
Axon Enterprise, Inc. or ZTO Express (Cayman) Inc.: Who Manages SG&A Costs Better?
Who Optimizes SG&A Costs Better? Axon Enterprise, Inc. or AECOM