| __timestamp | Axon Enterprise, Inc. | Expeditors International of Washington, Inc. |
|---|---|---|
| Wednesday, January 1, 2014 | 54158000 | 38125000 |
| Thursday, January 1, 2015 | 69698000 | 41990000 |
| Friday, January 1, 2016 | 108076000 | 41763000 |
| Sunday, January 1, 2017 | 138692000 | 44290000 |
| Monday, January 1, 2018 | 156886000 | 45346000 |
| Tuesday, January 1, 2019 | 212959000 | 44002000 |
| Wednesday, January 1, 2020 | 307286000 | 18436000 |
| Friday, January 1, 2021 | 515007000 | 16026000 |
| Saturday, January 1, 2022 | 401575000 | 24293000 |
| Sunday, January 1, 2023 | 496874000 | 27913000 |
| Monday, January 1, 2024 | 33331000 |
Unleashing the power of data
In the ever-evolving landscape of corporate finance, understanding operational costs is crucial. This analysis delves into the Selling, General, and Administrative (SG&A) expenses of two industry giants: Axon Enterprise, Inc. and Expeditors International of Washington, Inc., from 2014 to 2023.
Axon Enterprise has seen a remarkable increase in SG&A expenses, growing by over 800% from 2014 to 2023. This surge reflects the company's aggressive expansion and investment in innovation. Notably, 2021 marked a peak, with expenses reaching nearly 10 times the 2014 figures.
In contrast, Expeditors International maintained a more stable SG&A trajectory, with a modest 27% increase over the same period. This stability underscores the company's efficient cost management strategies, even amidst global supply chain challenges.
This comparative analysis highlights the diverse strategies companies employ to manage operational costs, offering valuable insights for investors and industry analysts.
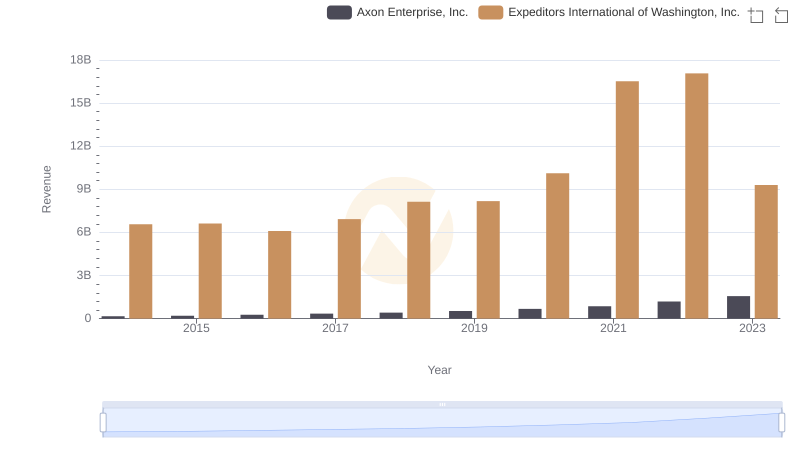
Annual Revenue Comparison: Axon Enterprise, Inc. vs Expeditors International of Washington, Inc.
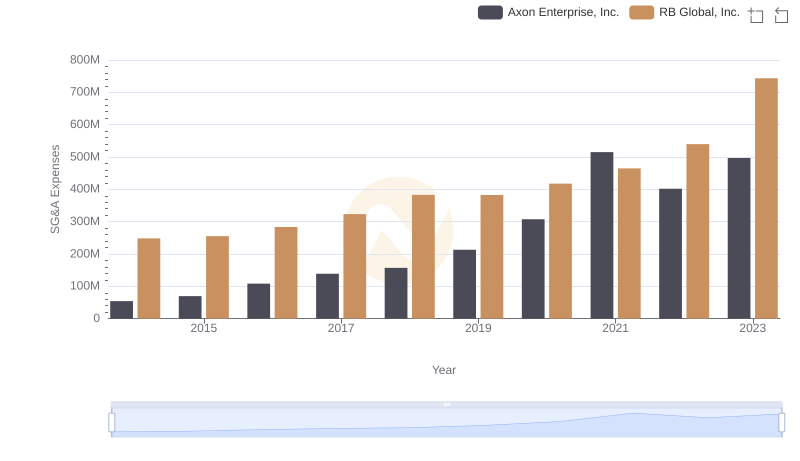
Axon Enterprise, Inc. vs RB Global, Inc.: SG&A Expense Trends
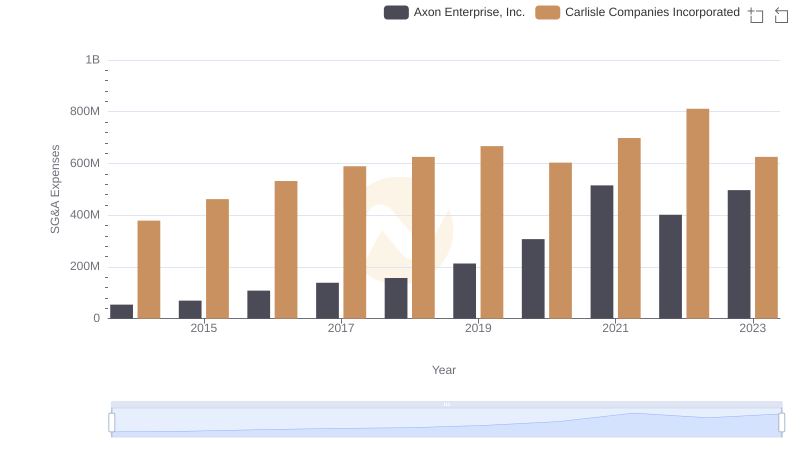
Breaking Down SG&A Expenses: Axon Enterprise, Inc. vs Carlisle Companies Incorporated
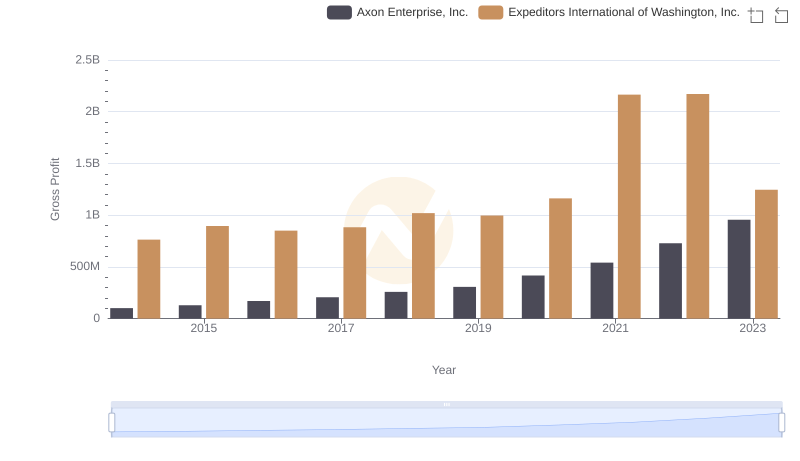
Who Generates Higher Gross Profit? Axon Enterprise, Inc. or Expeditors International of Washington, Inc.

Breaking Down SG&A Expenses: Axon Enterprise, Inc. vs China Eastern Airlines Corporation Limited

Who Optimizes SG&A Costs Better? Axon Enterprise, Inc. or Pentair plc
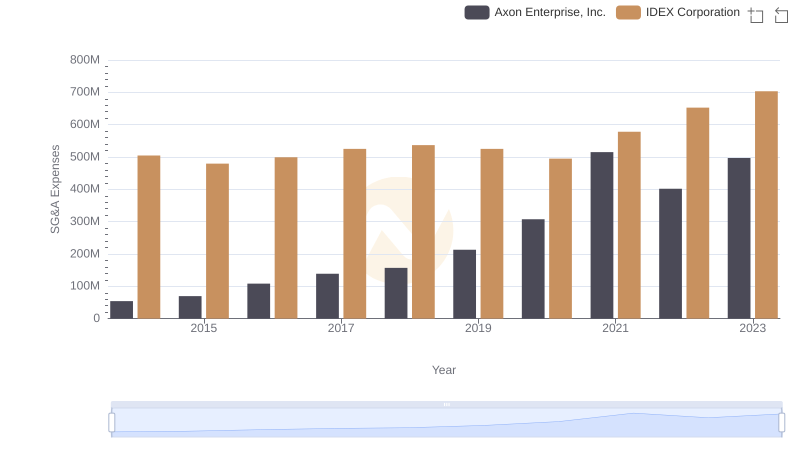
Comparing SG&A Expenses: Axon Enterprise, Inc. vs IDEX Corporation Trends and Insights
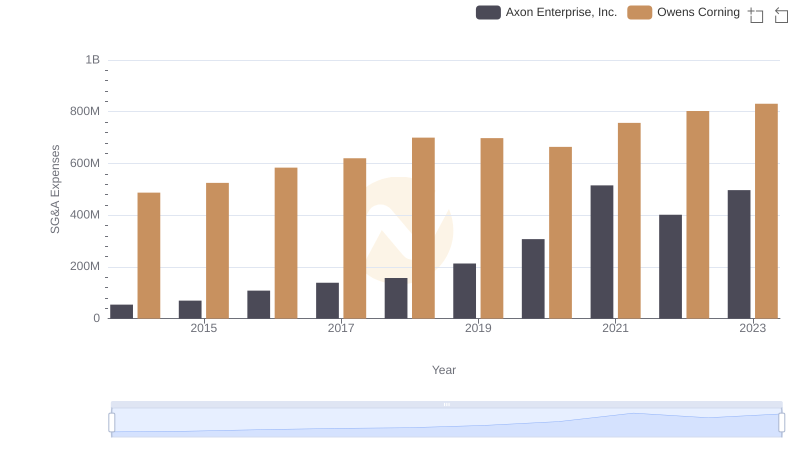
Comparing SG&A Expenses: Axon Enterprise, Inc. vs Owens Corning Trends and Insights
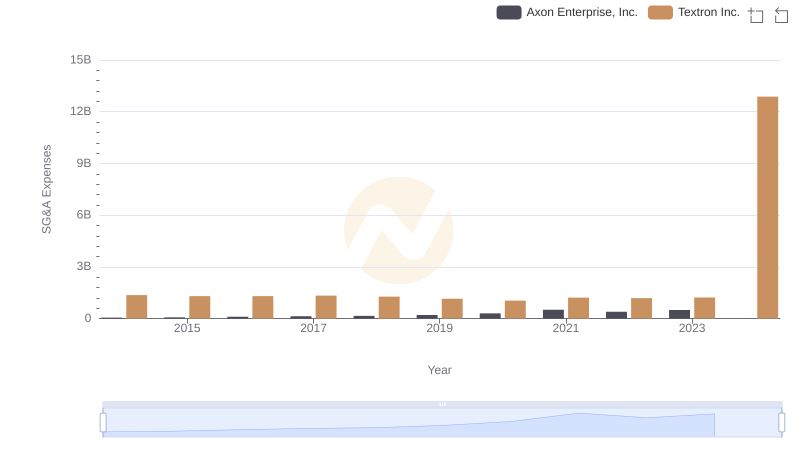
Axon Enterprise, Inc. or Textron Inc.: Who Manages SG&A Costs Better?
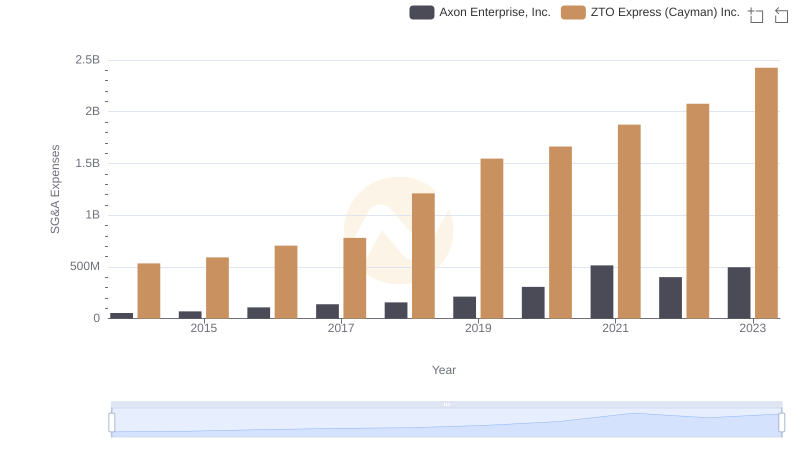
Axon Enterprise, Inc. or ZTO Express (Cayman) Inc.: Who Manages SG&A Costs Better?