| __timestamp | Axon Enterprise, Inc. | China Eastern Airlines Corporation Limited |
|---|---|---|
| Wednesday, January 1, 2014 | 54158000 | 4120000000 |
| Thursday, January 1, 2015 | 69698000 | 3651000000 |
| Friday, January 1, 2016 | 108076000 | 3133000000 |
| Sunday, January 1, 2017 | 138692000 | 3294000000 |
| Monday, January 1, 2018 | 156886000 | 3807000000 |
| Tuesday, January 1, 2019 | 212959000 | 4134000000 |
| Wednesday, January 1, 2020 | 307286000 | 1570000000 |
| Friday, January 1, 2021 | 515007000 | 1128000000 |
| Saturday, January 1, 2022 | 401575000 | 2933000000 |
| Sunday, January 1, 2023 | 496874000 | 7254000000 |
Igniting the spark of knowledge
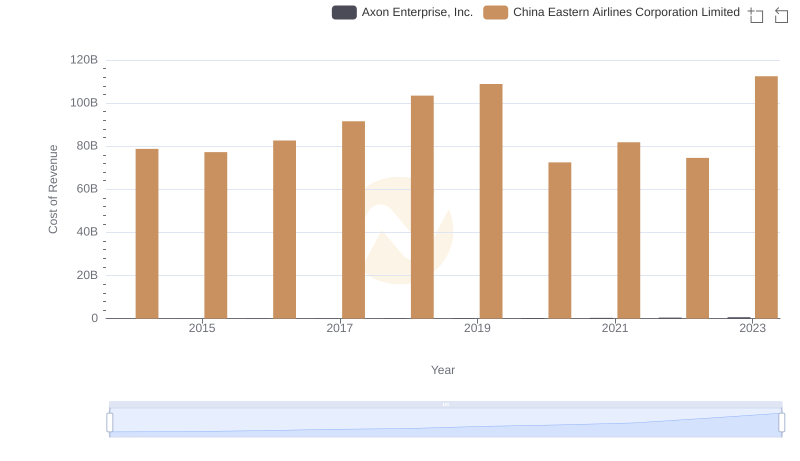
In the world of corporate finance, Selling, General, and Administrative (SG&A) expenses are a crucial indicator of a company's operational efficiency. This chart provides a fascinating comparison between Axon Enterprise, Inc., a leader in public safety technology, and China Eastern Airlines Corporation Limited, one of the major airlines in China, from 2014 to 2023.
Axon Enterprise, Inc. has seen a steady increase in SG&A expenses, growing by approximately 817% over the decade. This reflects their aggressive expansion and investment in innovation. In contrast, China Eastern Airlines experienced a more volatile trend, with a significant dip in 2020, likely due to the global pandemic, before skyrocketing by 543% in 2023. This surge could be attributed to the airline's recovery efforts and increased operational costs.
This comparison highlights the diverse challenges and strategies of companies in different sectors, offering valuable insights for investors and industry analysts.
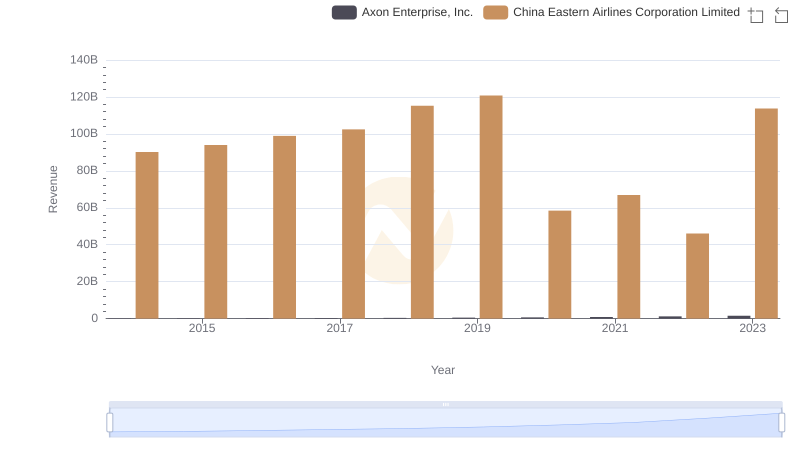
Axon Enterprise, Inc. and China Eastern Airlines Corporation Limited: A Comprehensive Revenue Analysis
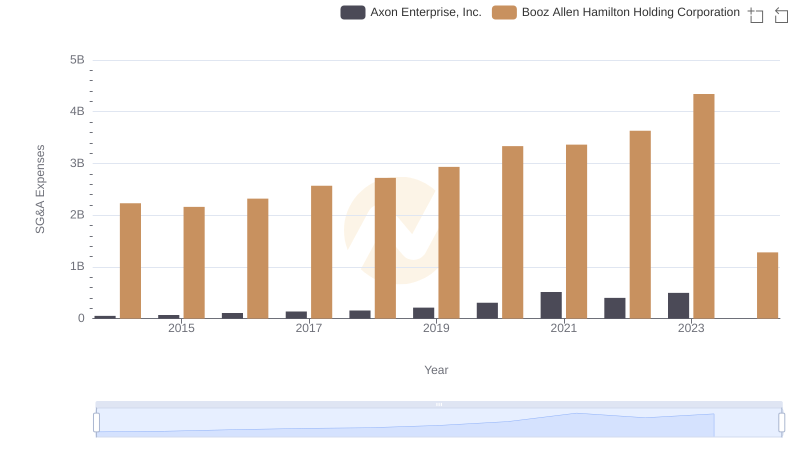
Axon Enterprise, Inc. vs Booz Allen Hamilton Holding Corporation: SG&A Expense Trends
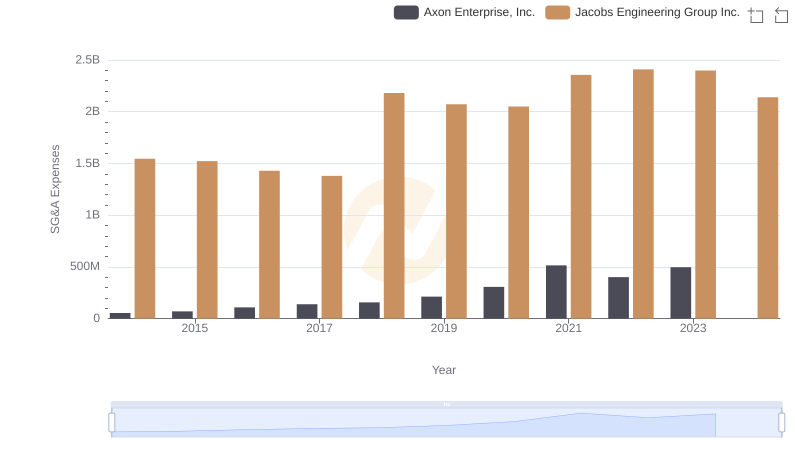
Axon Enterprise, Inc. and Jacobs Engineering Group Inc.: SG&A Spending Patterns Compared
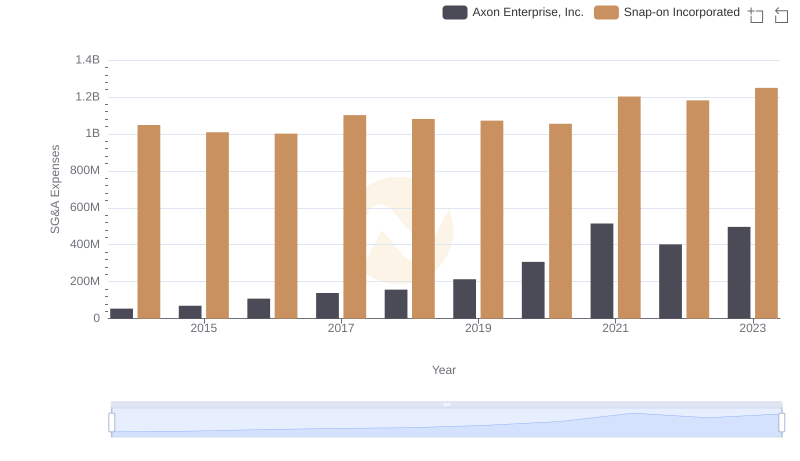
Axon Enterprise, Inc. or Snap-on Incorporated: Who Manages SG&A Costs Better?
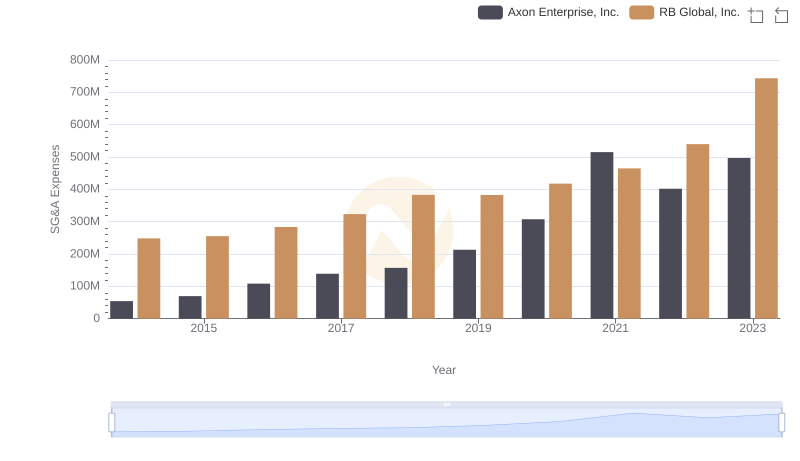
Axon Enterprise, Inc. vs RB Global, Inc.: SG&A Expense Trends
Cost Insights: Breaking Down Axon Enterprise, Inc. and China Eastern Airlines Corporation Limited's Expenses
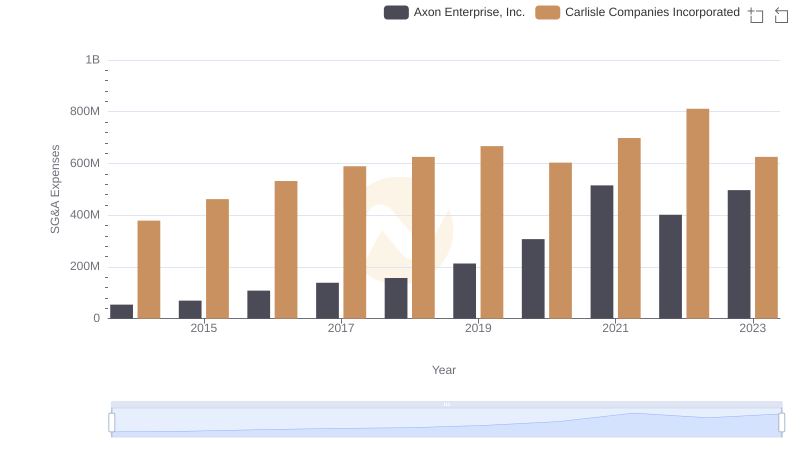
Breaking Down SG&A Expenses: Axon Enterprise, Inc. vs Carlisle Companies Incorporated

Who Optimizes SG&A Costs Better? Axon Enterprise, Inc. or Pentair plc
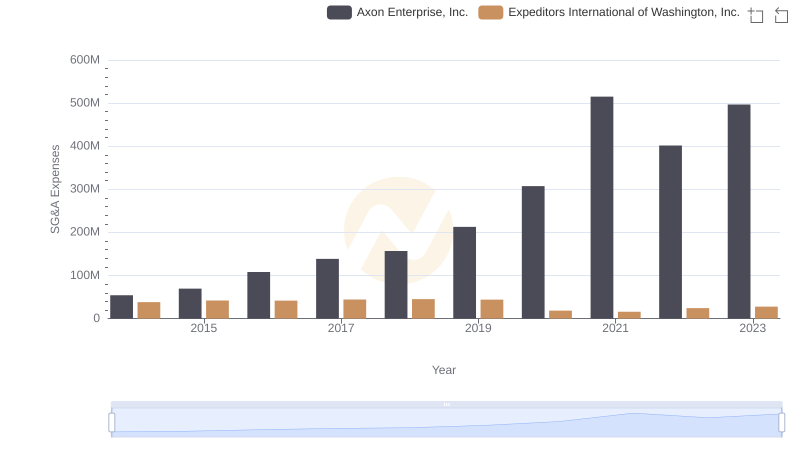
Operational Costs Compared: SG&A Analysis of Axon Enterprise, Inc. and Expeditors International of Washington, Inc.
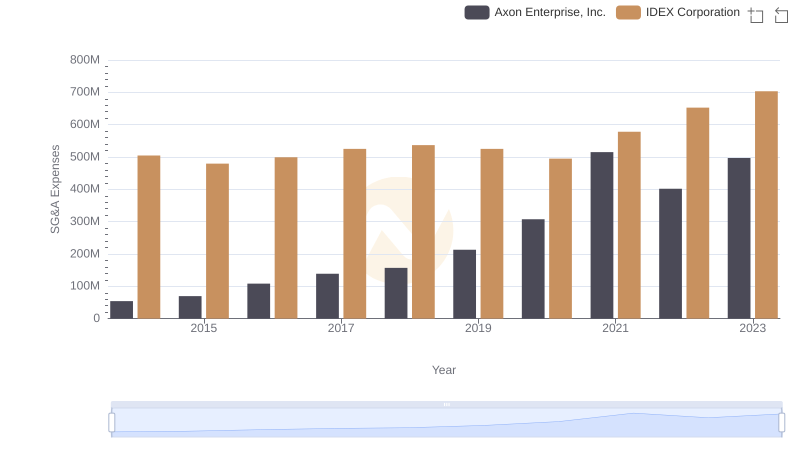
Comparing SG&A Expenses: Axon Enterprise, Inc. vs IDEX Corporation Trends and Insights
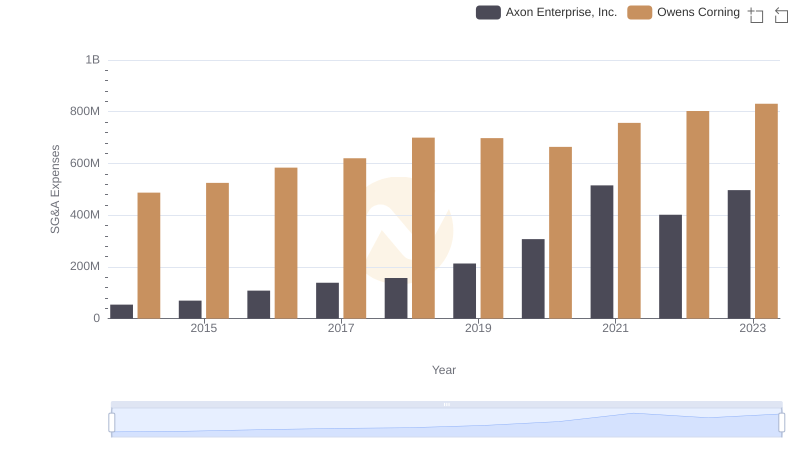
Comparing SG&A Expenses: Axon Enterprise, Inc. vs Owens Corning Trends and Insights