| __timestamp | Axon Enterprise, Inc. | IDEX Corporation |
|---|---|---|
| Wednesday, January 1, 2014 | 164525000 | 2147767000 |
| Thursday, January 1, 2015 | 197892000 | 2020668000 |
| Friday, January 1, 2016 | 268245000 | 2113043000 |
| Sunday, January 1, 2017 | 343798000 | 2287312000 |
| Monday, January 1, 2018 | 420068000 | 2483666000 |
| Tuesday, January 1, 2019 | 530860000 | 2494573000 |
| Wednesday, January 1, 2020 | 681003000 | 2351646000 |
| Friday, January 1, 2021 | 863381000 | 2764800000 |
| Saturday, January 1, 2022 | 1189935000 | 3181900000 |
| Sunday, January 1, 2023 | 1563391000 | 3273900000 |
| Monday, January 1, 2024 | 3268800000 |
Infusing magic into the data realm
In the ever-evolving landscape of the technology and industrial sectors, Axon Enterprise, Inc. and IDEX Corporation have carved distinct paths over the past decade. From 2014 to 2023, Axon Enterprise, Inc. has seen its revenue grow nearly tenfold, from approximately $165 million to over $1.56 billion. This represents an impressive annual growth rate of around 30%, underscoring its dynamic expansion in the public safety technology market.
Conversely, IDEX Corporation, a stalwart in the industrial sector, has maintained a steady revenue increase, growing from $2.15 billion in 2014 to $3.27 billion in 2023. This consistent growth highlights IDEX's robust market position and strategic acquisitions.
While Axon’s rapid growth reflects its innovative approach and market penetration, IDEX’s steady climb showcases its resilience and adaptability. This comparison offers a fascinating glimpse into how two companies can thrive through different strategies in their respective industries.
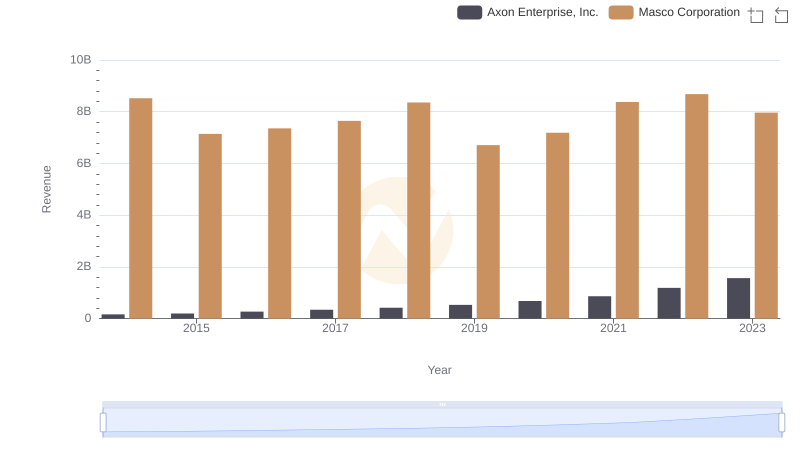
Axon Enterprise, Inc. and Masco Corporation: A Comprehensive Revenue Analysis
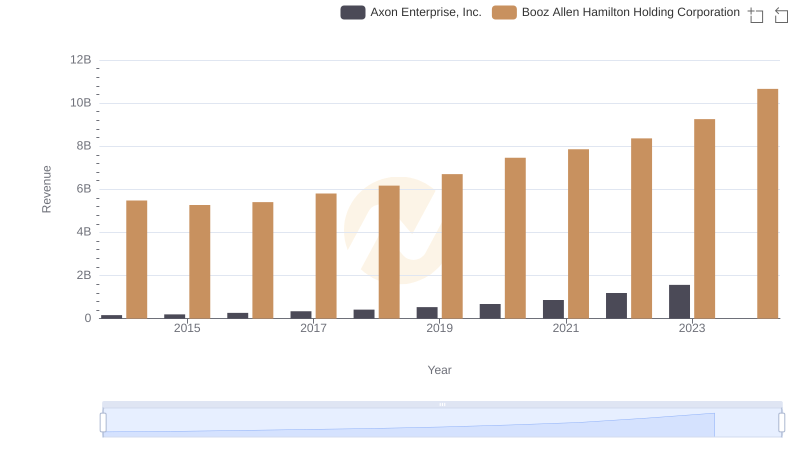
Annual Revenue Comparison: Axon Enterprise, Inc. vs Booz Allen Hamilton Holding Corporation
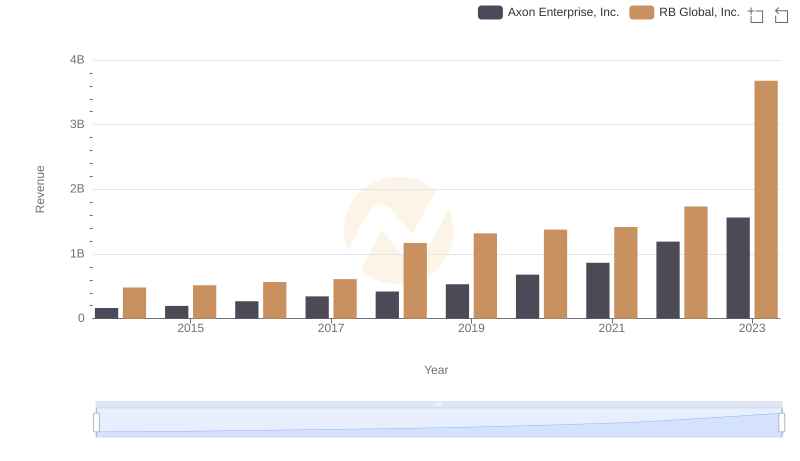
Revenue Insights: Axon Enterprise, Inc. and RB Global, Inc. Performance Compared
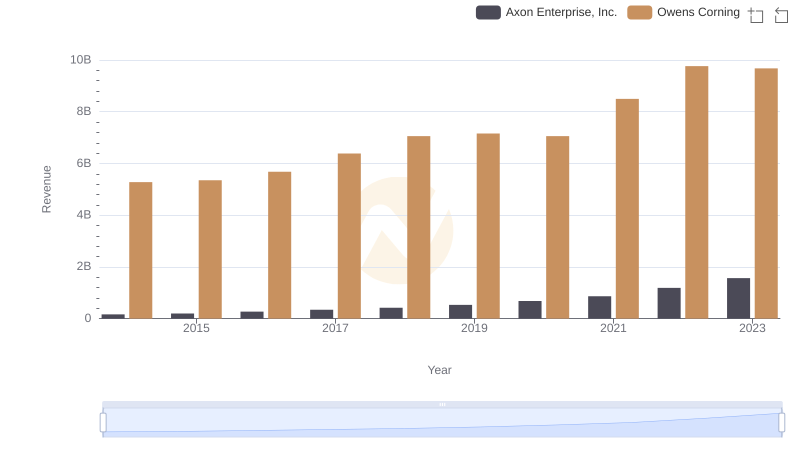
Who Generates More Revenue? Axon Enterprise, Inc. or Owens Corning
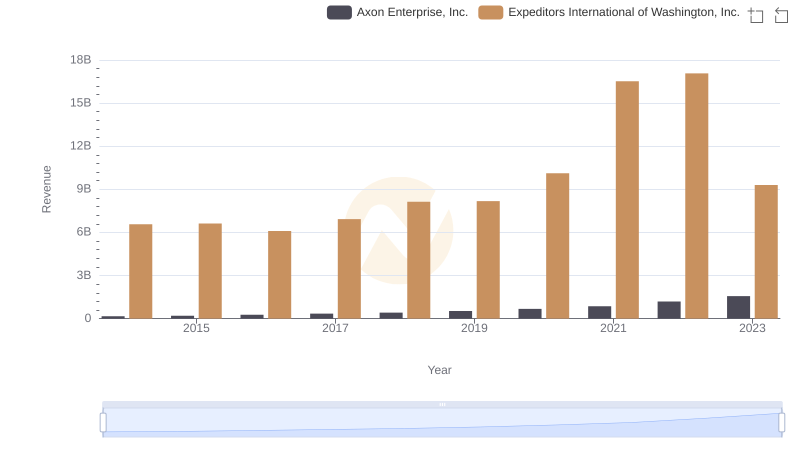
Annual Revenue Comparison: Axon Enterprise, Inc. vs Expeditors International of Washington, Inc.
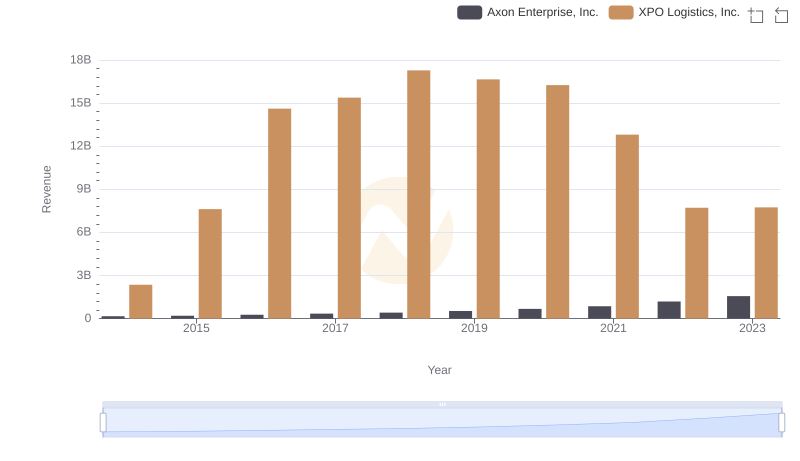
Who Generates More Revenue? Axon Enterprise, Inc. or XPO Logistics, Inc.
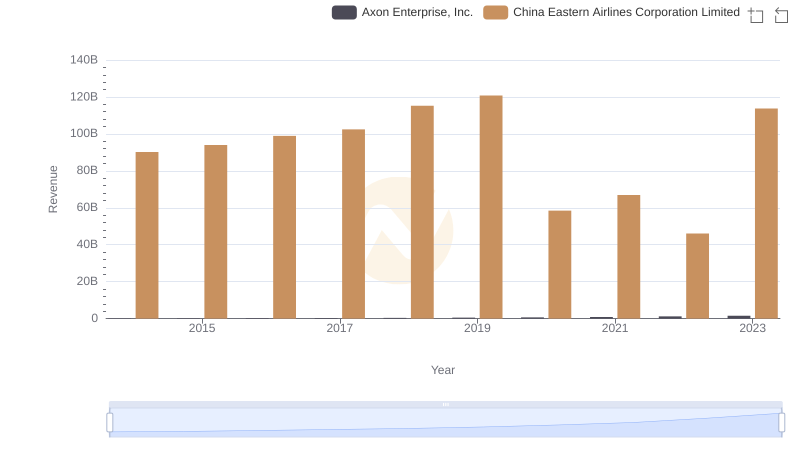
Axon Enterprise, Inc. and China Eastern Airlines Corporation Limited: A Comprehensive Revenue Analysis
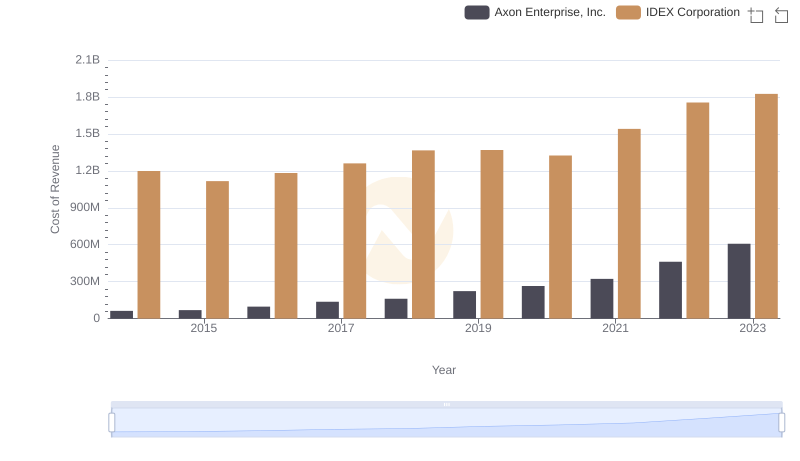
Comparing Cost of Revenue Efficiency: Axon Enterprise, Inc. vs IDEX Corporation
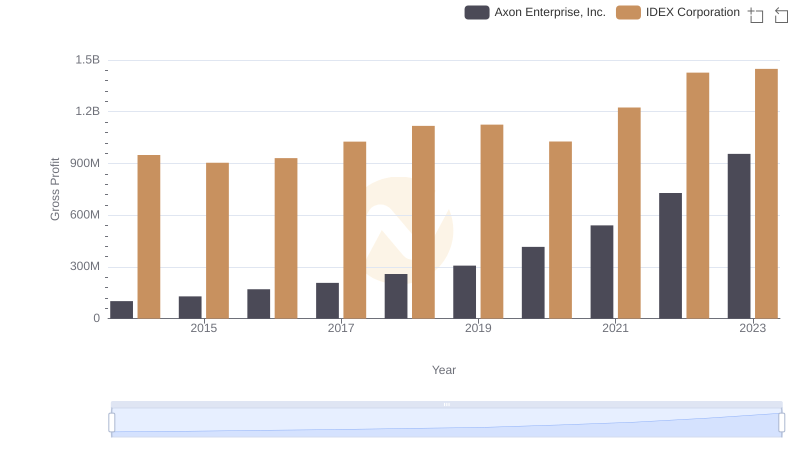
Key Insights on Gross Profit: Axon Enterprise, Inc. vs IDEX Corporation
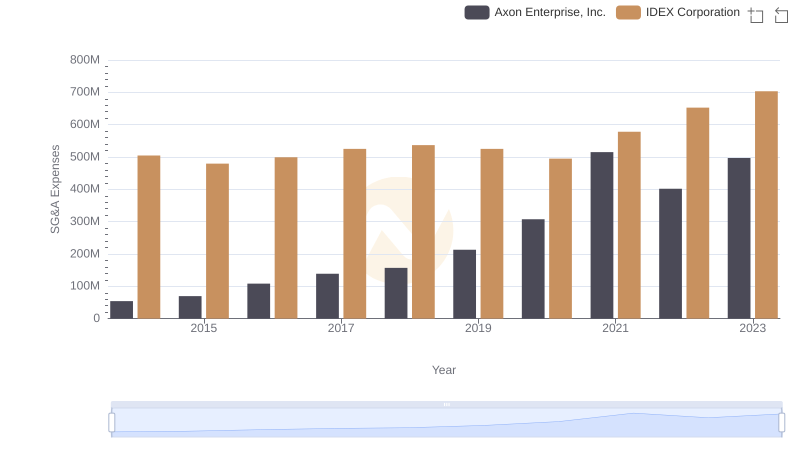
Comparing SG&A Expenses: Axon Enterprise, Inc. vs IDEX Corporation Trends and Insights