| __timestamp | American Airlines Group Inc. | EMCOR Group, Inc. |
|---|---|---|
| Wednesday, January 1, 2014 | 42650000000 | 6424965000 |
| Thursday, January 1, 2015 | 40990000000 | 6718726000 |
| Friday, January 1, 2016 | 40180000000 | 7551524000 |
| Sunday, January 1, 2017 | 42207000000 | 7686999000 |
| Monday, January 1, 2018 | 44541000000 | 8130631000 |
| Tuesday, January 1, 2019 | 45768000000 | 9174611000 |
| Wednesday, January 1, 2020 | 17337000000 | 8797061000 |
| Friday, January 1, 2021 | 29882000000 | 9903580000 |
| Saturday, January 1, 2022 | 48971000000 | 11076120000 |
| Sunday, January 1, 2023 | 52788000000 | 12582873000 |
Unveiling the hidden dimensions of data
In the ever-evolving landscape of American business, two giants stand out: EMCOR Group, Inc. and American Airlines Group Inc. Over the past decade, these companies have showcased resilience and growth, albeit in different sectors. From 2014 to 2023, American Airlines' revenue soared by approximately 24%, peaking in 2023. Despite a dip in 2020, likely due to the global pandemic, the airline rebounded strongly, highlighting its adaptability.
Conversely, EMCOR Group, a leader in construction and facilities services, demonstrated steady growth, with a remarkable 96% increase in revenue over the same period. By 2023, EMCOR's revenue reached nearly a quarter of American Airlines', underscoring its robust expansion strategy. This comparison not only highlights the diverse challenges and opportunities faced by these industries but also underscores the dynamic nature of the American economy.
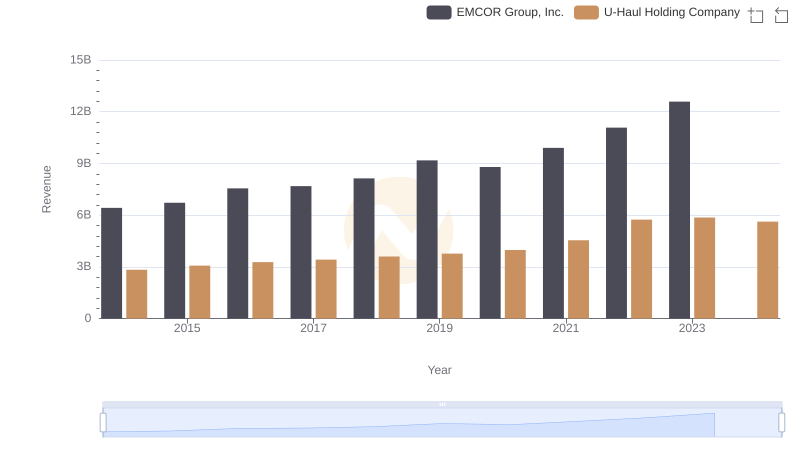
Comparing Revenue Performance: EMCOR Group, Inc. or U-Haul Holding Company?
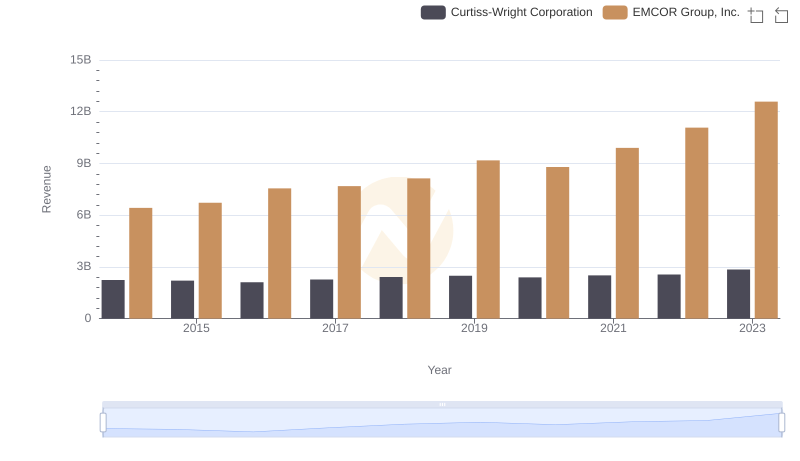
Comparing Revenue Performance: EMCOR Group, Inc. or Curtiss-Wright Corporation?
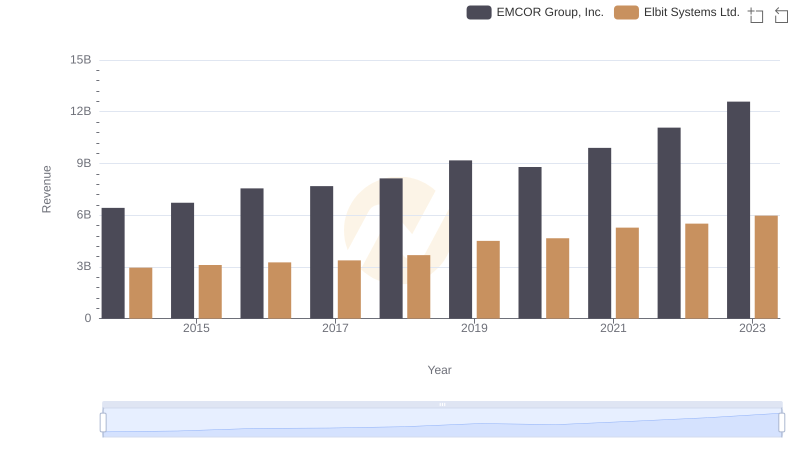
Comparing Revenue Performance: EMCOR Group, Inc. or Elbit Systems Ltd.?
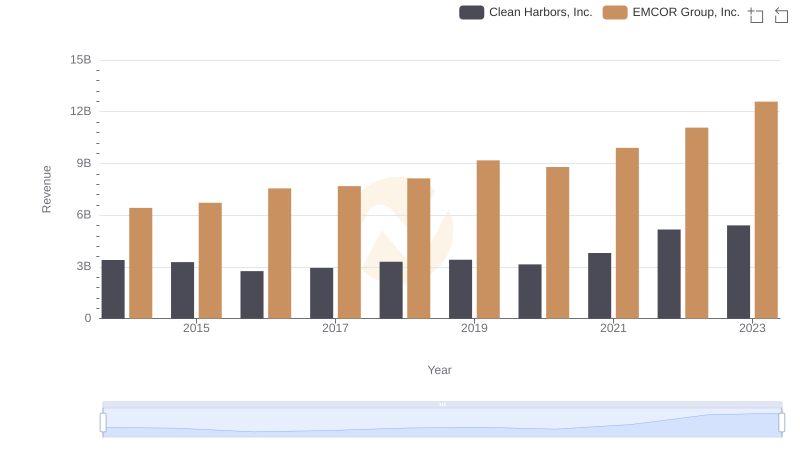
Breaking Down Revenue Trends: EMCOR Group, Inc. vs Clean Harbors, Inc.
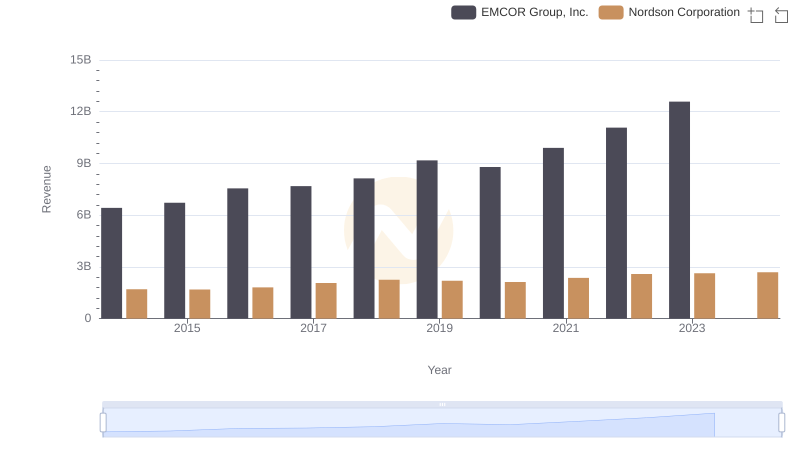
Who Generates More Revenue? EMCOR Group, Inc. or Nordson Corporation
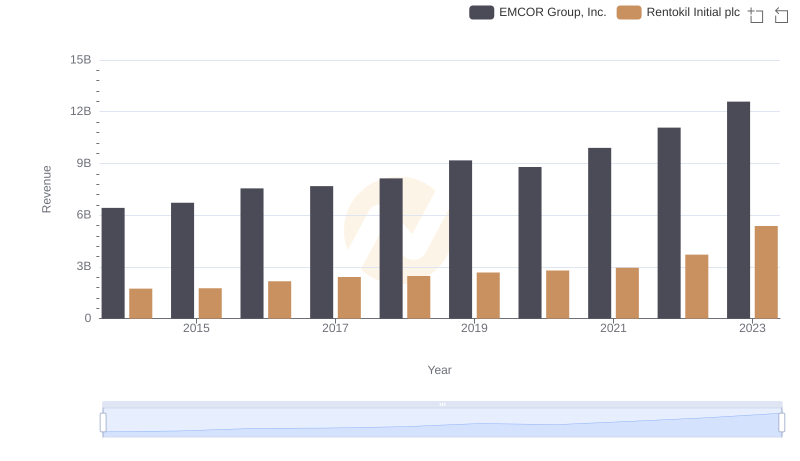
Who Generates More Revenue? EMCOR Group, Inc. or Rentokil Initial plc
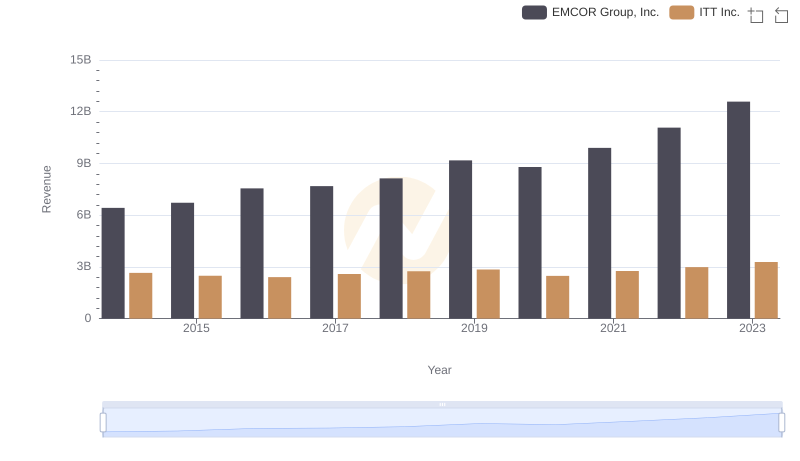
EMCOR Group, Inc. vs ITT Inc.: Annual Revenue Growth Compared
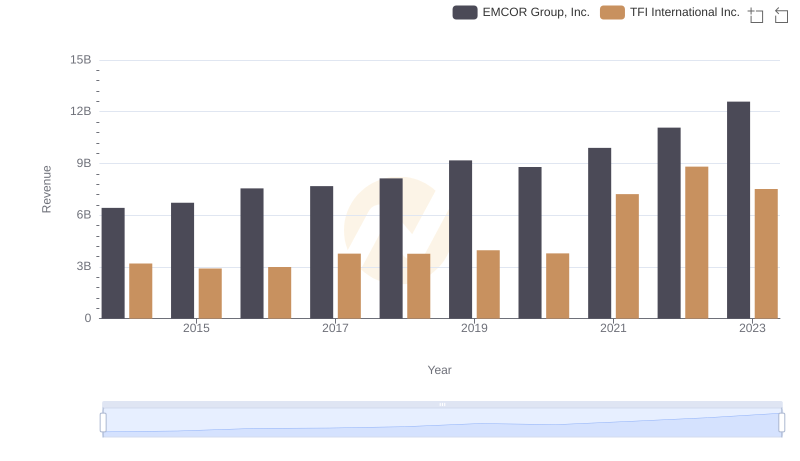
Comparing Revenue Performance: EMCOR Group, Inc. or TFI International Inc.?
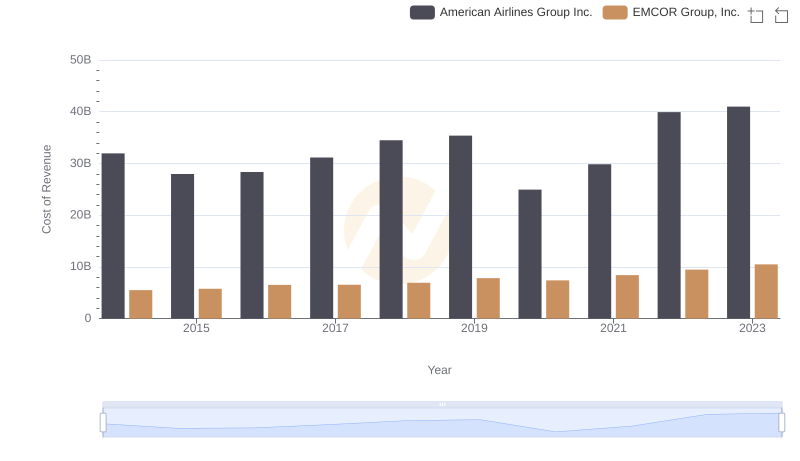
Cost of Revenue: Key Insights for EMCOR Group, Inc. and American Airlines Group Inc.